How to trade candlestick charts: A beginner’s guide to candle patterns
At first glance, they look like simple rectangles with sticks. But once you know what to look for, candlestick charts reveal who’s in control, when trends shift, and when it might be the right time to trade. In this guide, you’ll learn how to read candlesticks, spot the best patterns, and trade them like a pro.
How do you read candlestick charts and trade them?
A candlestick shows price movement through four data points — open, close, high, low. Its shape, color, and length reveal who's in control of the market, and recurring combinations (patterns) can signal a reversal or continuation. Learning the most common patterns is a solid foundation — one that also helps when working through a Fintokei challenge.
How to read candlestick patterns? Download our e-book!
Why candlestick charts matter
Candlestick charts are the foundation of technical analysis. Whether you're trading forex, crypto, or stocks – you'll always find traders who rely on candlestick chart analysis to decide when to buy and when to step back.
Compared to basic line charts, candle charts offer a much deeper view into price action. They reveal the emotions behind every move – fear, greed, hesitation, or confidence. And reading those emotions gives you an edge when making trading decisions.
💡 Fintokei tip
Candlestick patterns aren't magic signals. But they're real clues that can help you stay in tune with the market. Once you understand what a forex candle means, your decisions get quicker and smarter.
What is a candlestick and why it matters
A candlestick isn't just a random chart pattern – it's a mini story about what happened in the market during a specific time period. Every forex candle contains four key price points:
- Open – where the price started,
- Close – where the price ended,
- High – the highest point the price reached,
- Low – the lowest point during that time frame.
These four values create the shape of the candlestick. And that shape is crucial for any trader.
- The body (the main block) shows the distance between the opening and closing prices. If the price went up, the body is usually green or white. If it went down, it's red or black.
- The wicks (also called shadows) show how far the price moved above or below the body – giving you a full view of market activity.
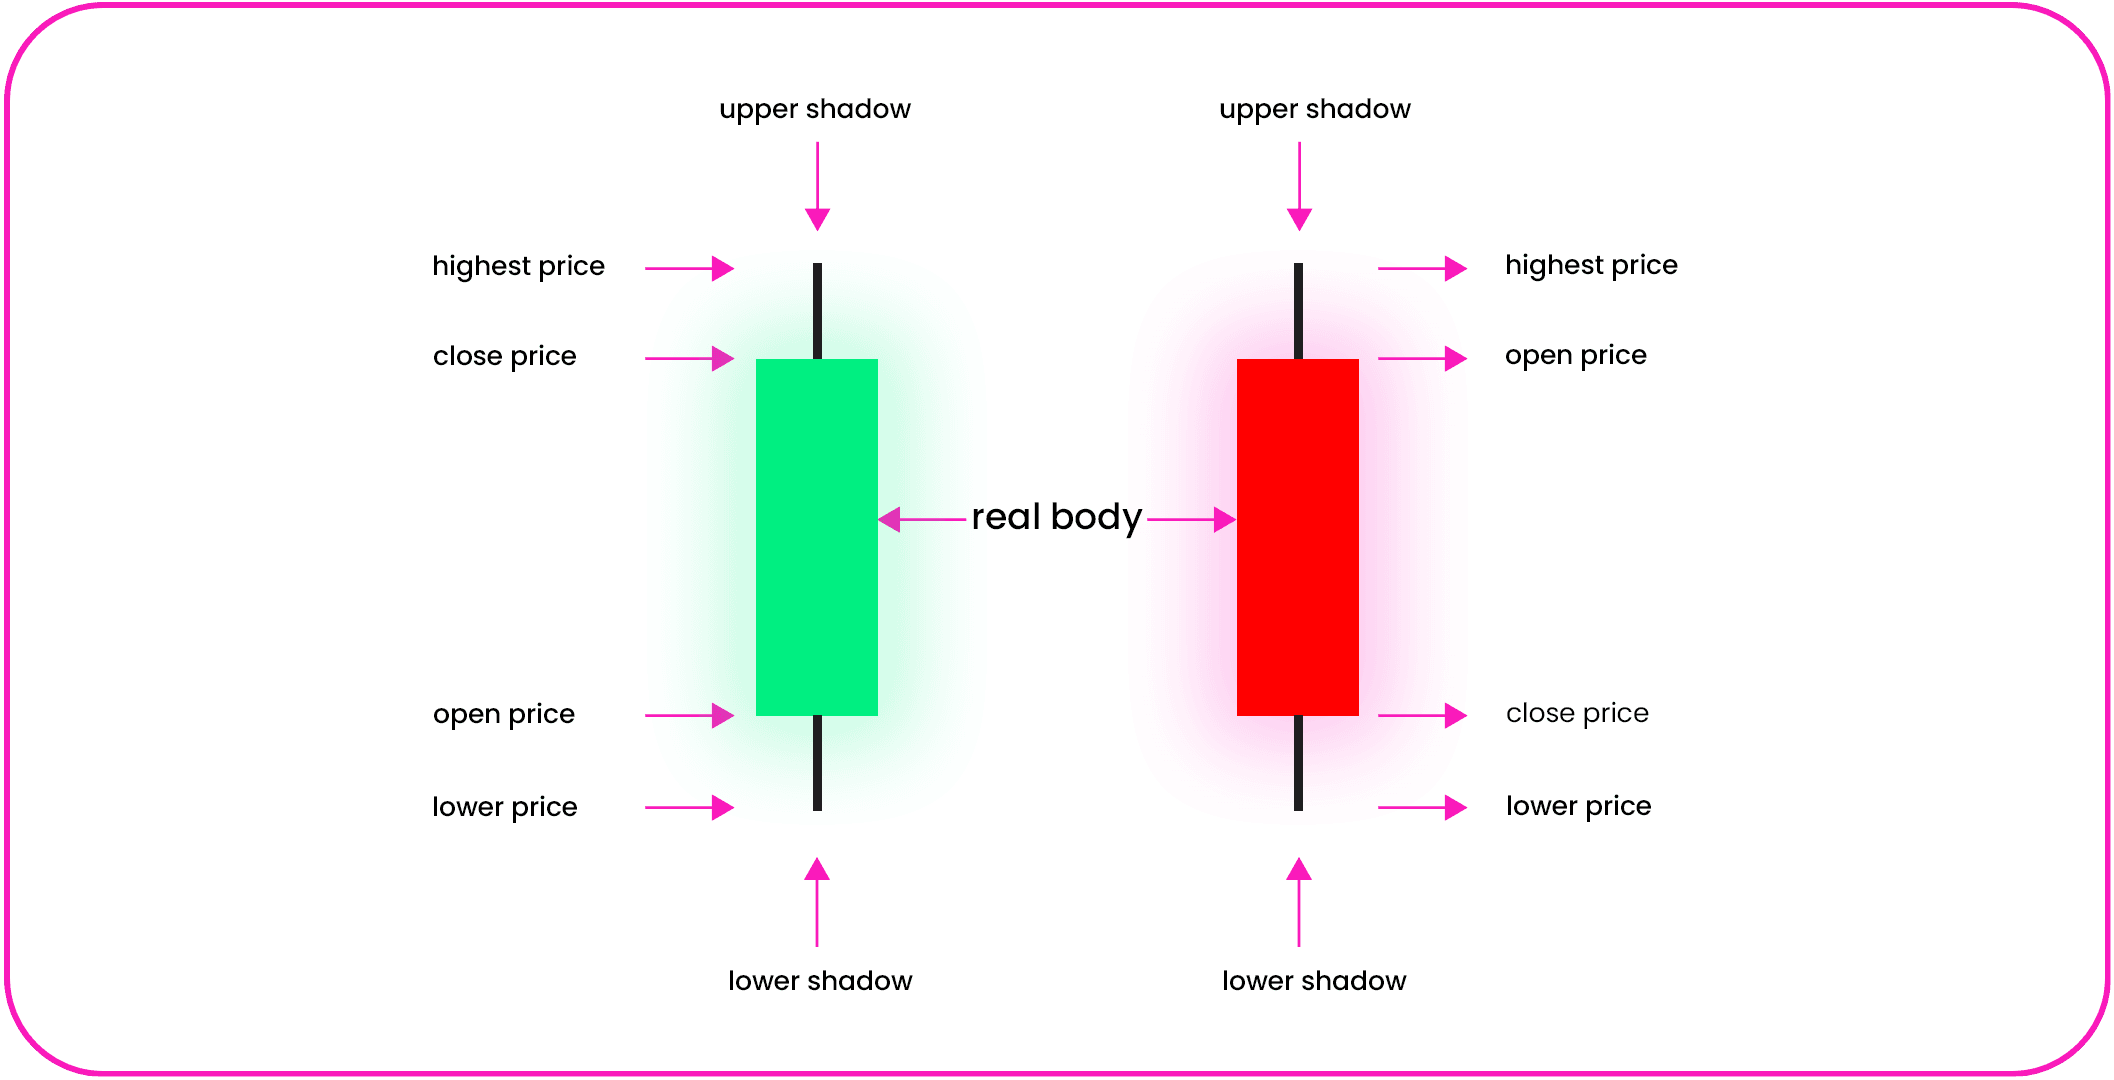
That's one single candle. Now imagine lining up hundreds of them – suddenly, you've got a full picture of price movement. That's what candlestick chart analysis is all about – reading the market like a book.
What does the shape and length of a candle tell you?
The shape, size, and color of each candle tell you way more than a long-winded analyst note. You can learn what's happening right now – and what might happen next.
This is what traders call price action – reading the raw price without relying on heavy indicators. And candlestick trading is the foundation of that mindset.
How to read a candlestick chart: First step to market analysis
Now that you know what a candlestick is and how it works, it's time to level up – by learning how to read candlestick charts as a whole.
Because a single forex candle is just a snapshot. But when you start spotting trading candlestick patterns, that's where the real power begins.
Each candlestick has meaning. But once you start connecting them and seeing the bigger picture, you'll uncover something called candlestick patterns – repeating combinations that show up in specific market situations.
Here are some quick examples:
- Several green candles in a row with large bodies? That usually signals strong bullish momentum.
- A small candle with a long upper wick at the top of a market trend? Could mean buyers are losing steam.
- A tiny body with long wicks on both sides? The market is confused and directionless.
Curious what's inside?
Create a free account and explore the Fintokei zone — loyalty rewards, dashboards, refer a friend and more. No challenge required.
Which timeframe should you watch?
Each candlestick represents price movement within a specific time period – that's your timeframe. If your chart is set to 5 minutes, each candle shows what happened in that 5-minute window. If it's a daily chart, one candle = one full trading day.
💡 Fintokei tip
Most Fintokei traders usually stick with the daily (D1) or 4-hour (H4) charts. They're calmer, less noisy, and give you a better read on actual market sentiment.
Don't expect perfection
Real charts don't look like textbook examples. Markets are messy and emotional. The best candlestick trading patterns often appear a bit "off" or slightly different from how you saw them in tutorials. That's fine.
The point is to understand the idea behind the pattern – who's in control? Buyers or sellers?
The most popular candlestick patterns and how to trade them
There's one unspoken rule in trading – if a pattern shows up often enough, the market "remembers" it. And that's exactly what candlestick patterns are all about. There are tons of them, but let's start with the most common ones – the ones you'll actually see in real charts and can trade even as a beginner.
Bullish patterns – signals to buy
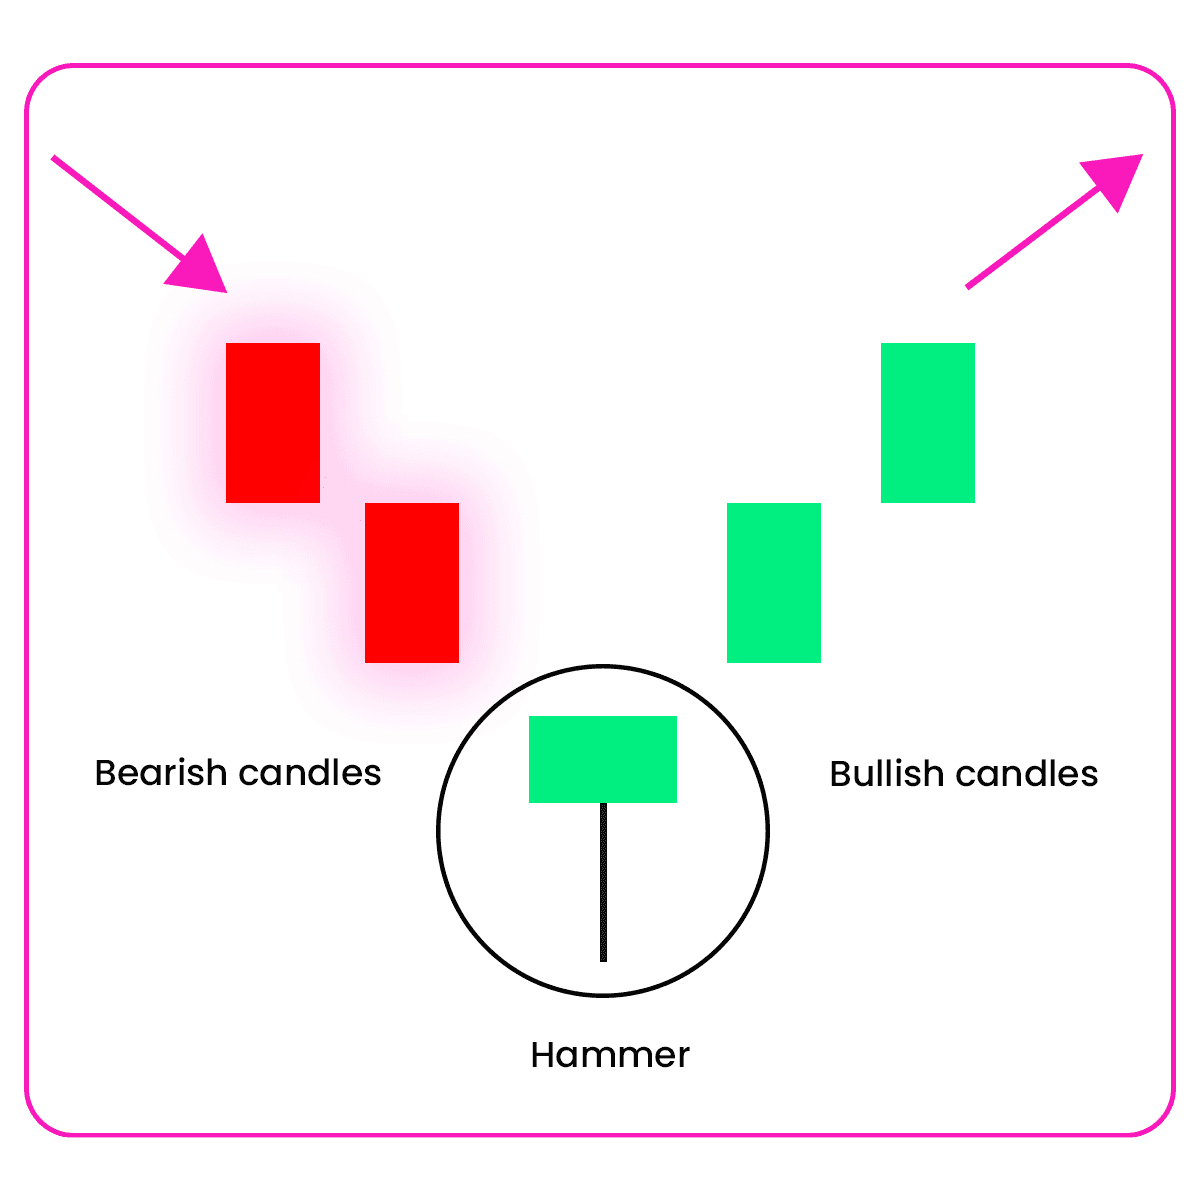
Hammer
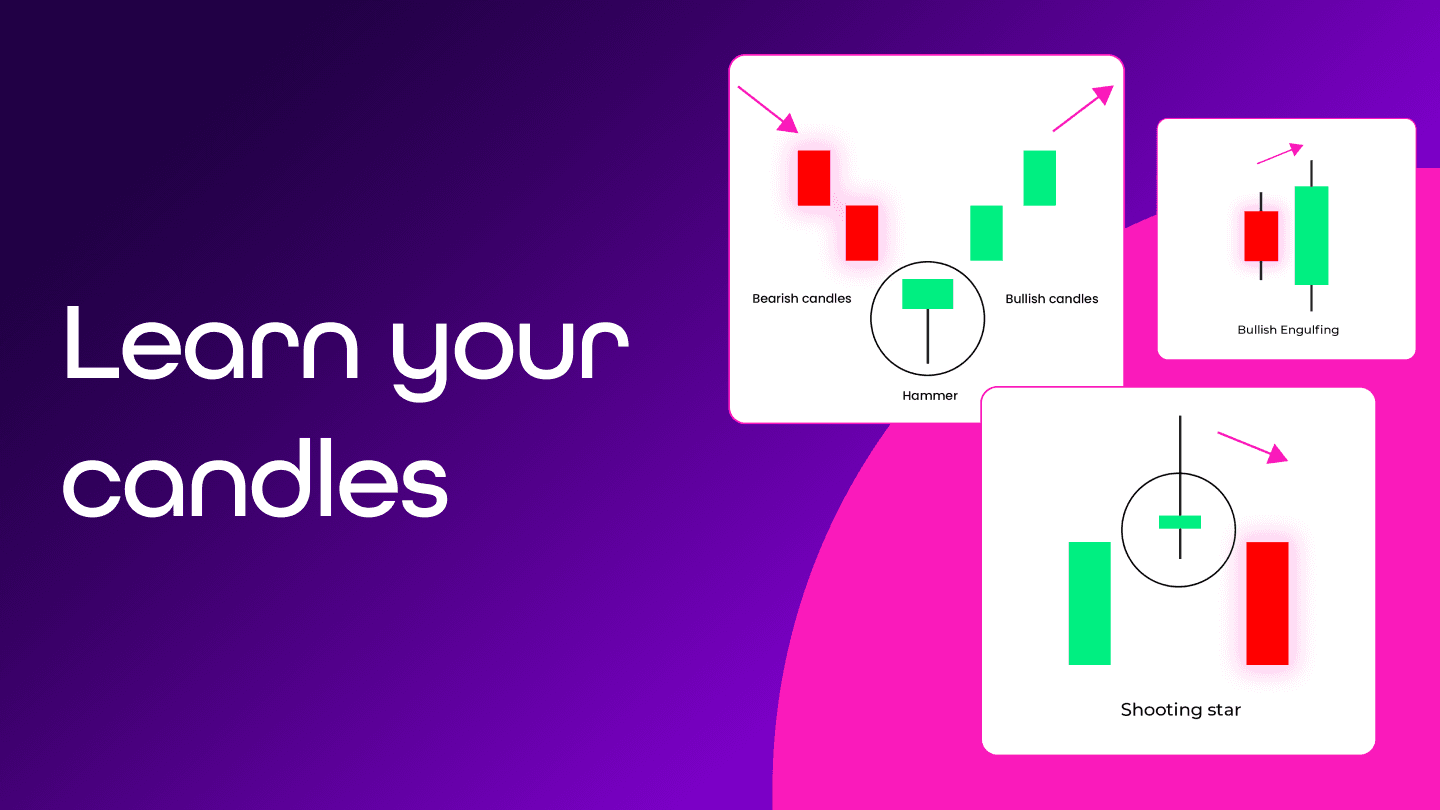
Looks like a small rectangle with a long lower wick. It appears at the bottom of a downtrend and signals that sellers tried to push the price lower – but buyers stepped in and pulled it back up.
How to trade it: Wait for the next candlestick. If it moves up, you can enter a buy trade. Set a clear exit level in case the market turns against you – for example, just below the hammer's low.
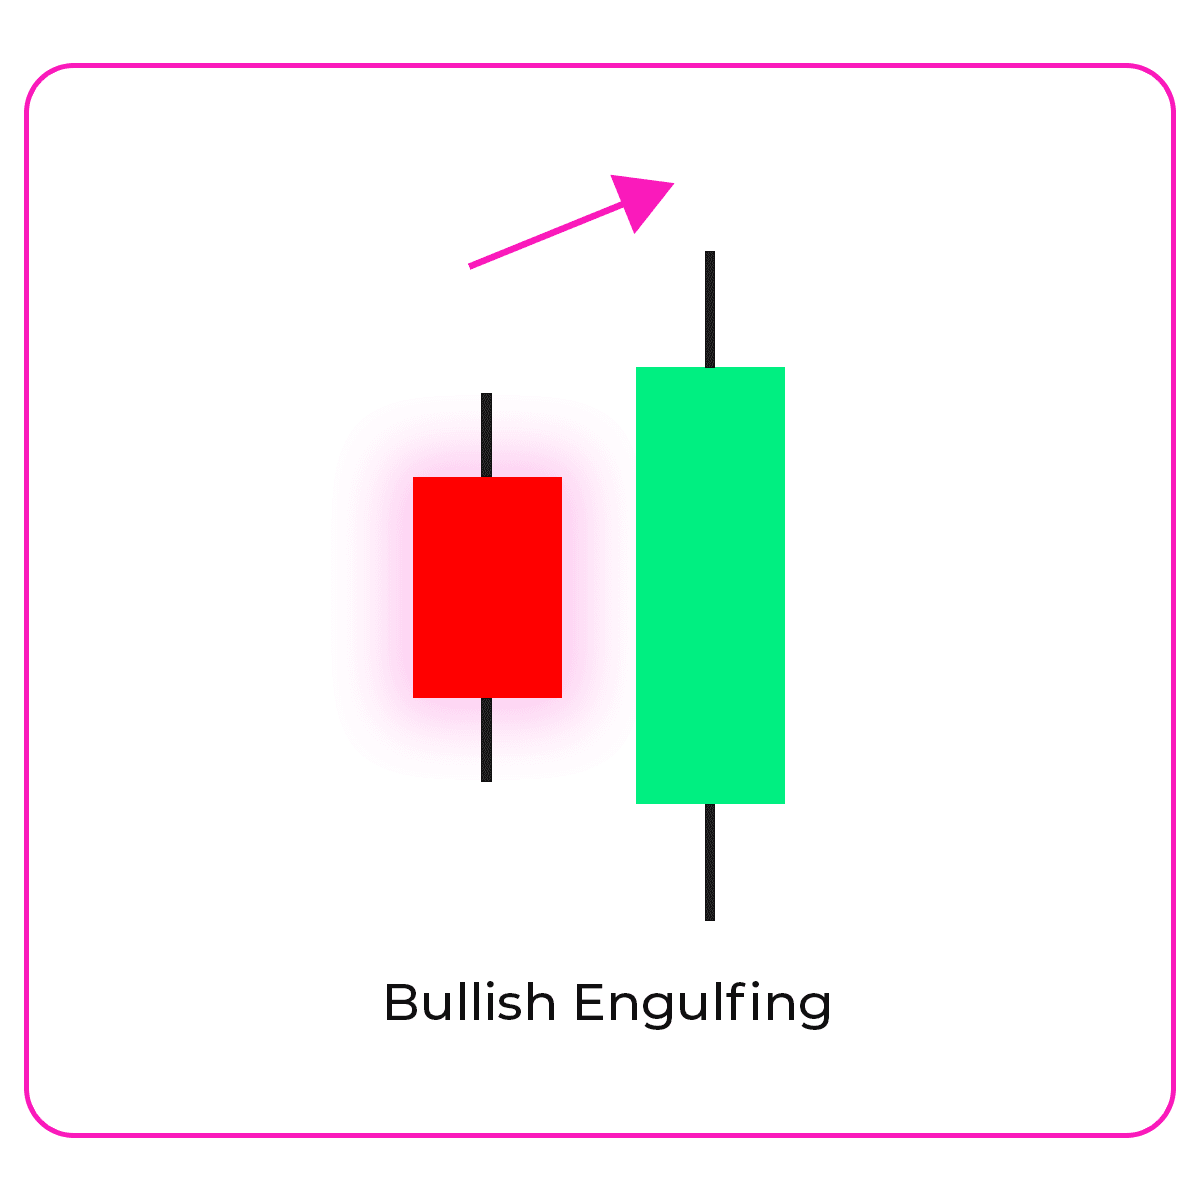
Bullish engulfing
A classic forex candlestick pattern made up of two candles. First one is red (price dropped), second one is green (price climbed) – and it completely covers the first. That means buyers are gaining control.
How to trade it: If another green candle follows, consider buying. Look for confirmation – like rising volume or support from another candle pattern.
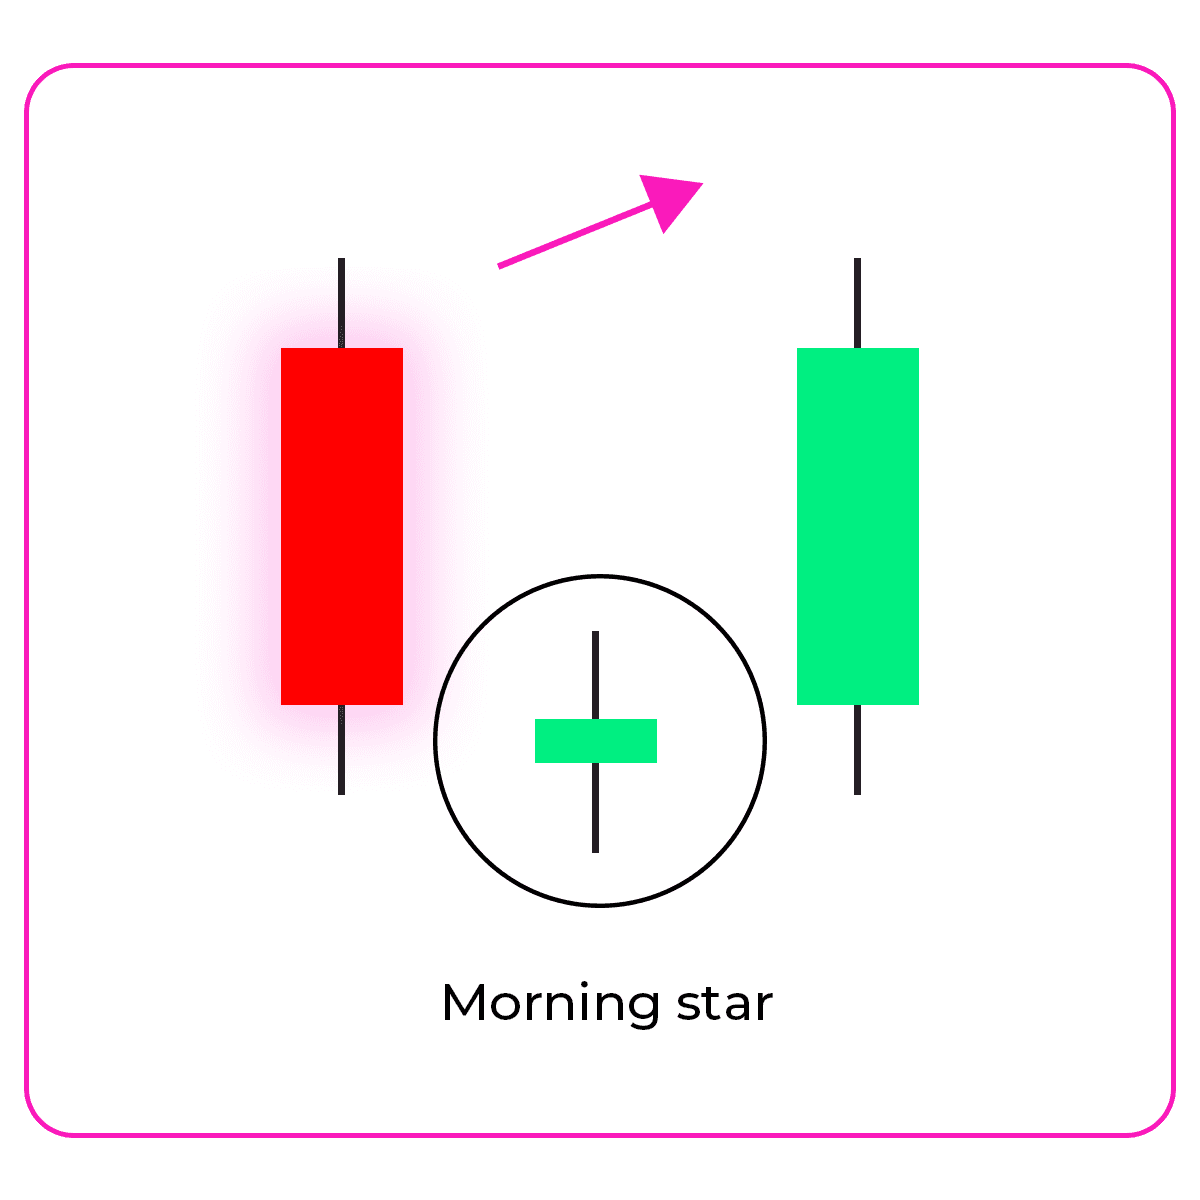
Morning star
This trading candlestick pattern has three candles: a strong bearish candle, a small indecision candle (often a doji), and a strong bullish candle. It signals a possible reversal to the upside.
How to trade it: If the price starts to rise after the third candle, you can enter a buy trade. Define your exit in case things reverse.
Bearish patterns – signals to sell
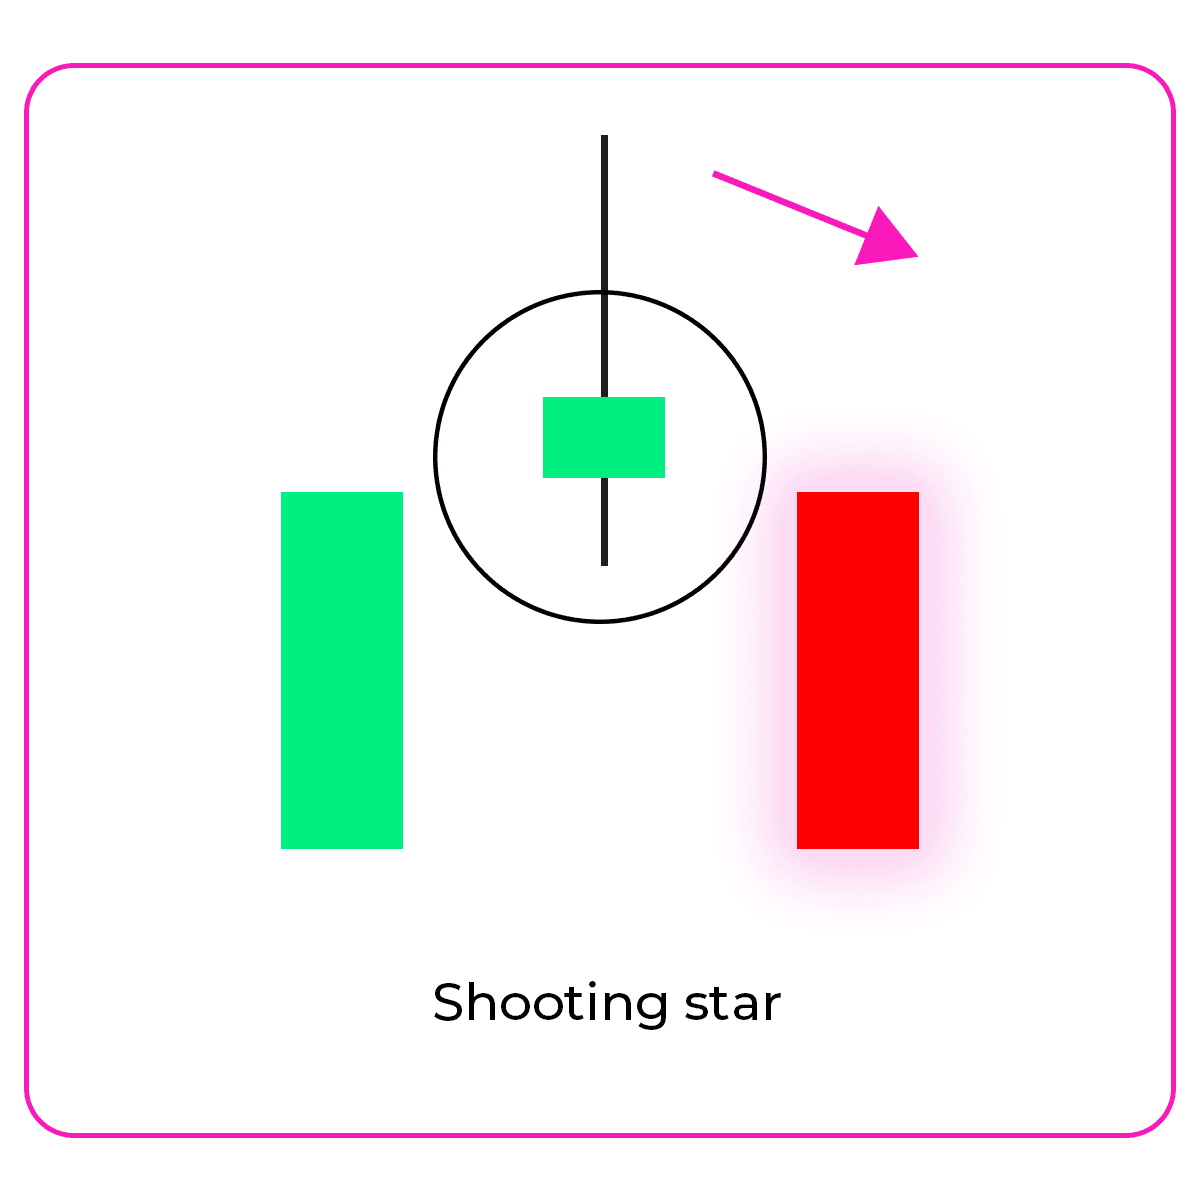
Shooting star
A small-bodied candle with a long upper wick. Appears after an uptrend and tells you the market tried to break higher but failed. Sellers took over.
How to trade it: If the next candlestick is bearish, you can either sell or close any open buy positions. Always have a risk plan in place.
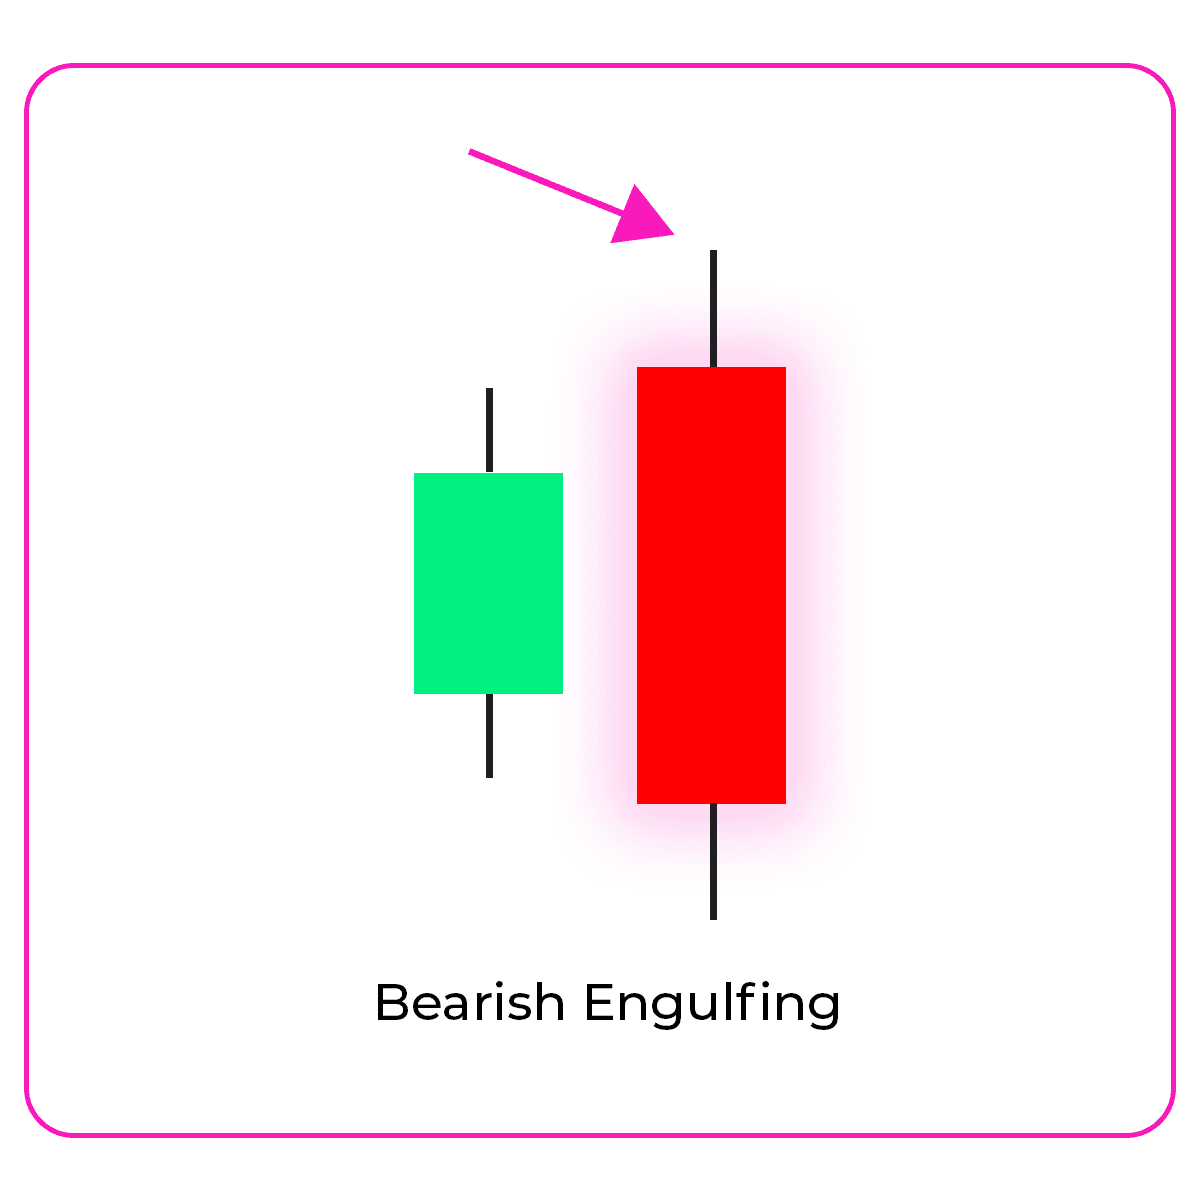
Bearish engulfing
The opposite of the bullish version. The first candle is green, second is red – and the red one engulfs the green one. Time to get cautious.
How to trade it: If followed by more selling pressure, this candlestick pattern can be a good reason to short. Look for volume or structure confirmation.
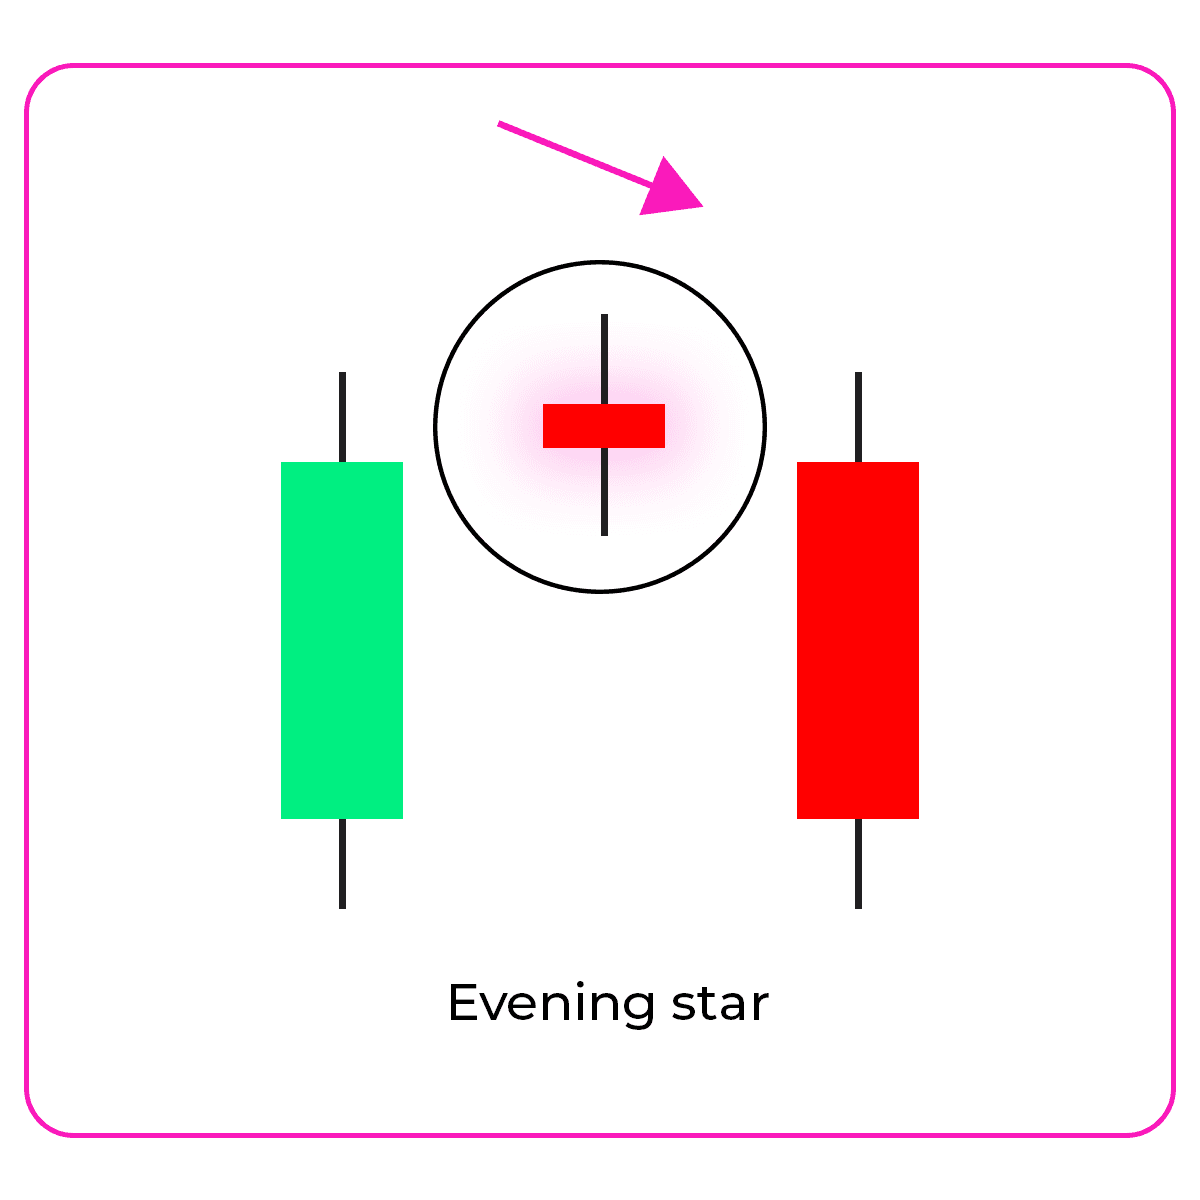
Evening star
Three candles: a bullish candle, a small indecisive one, and then a strong bearish candle. A clear warning that the uptrend may be ending.
How to trade it: If the market starts dropping after the third candle, you may want to sell or exit your longs.
Neutral patterns – market indecision
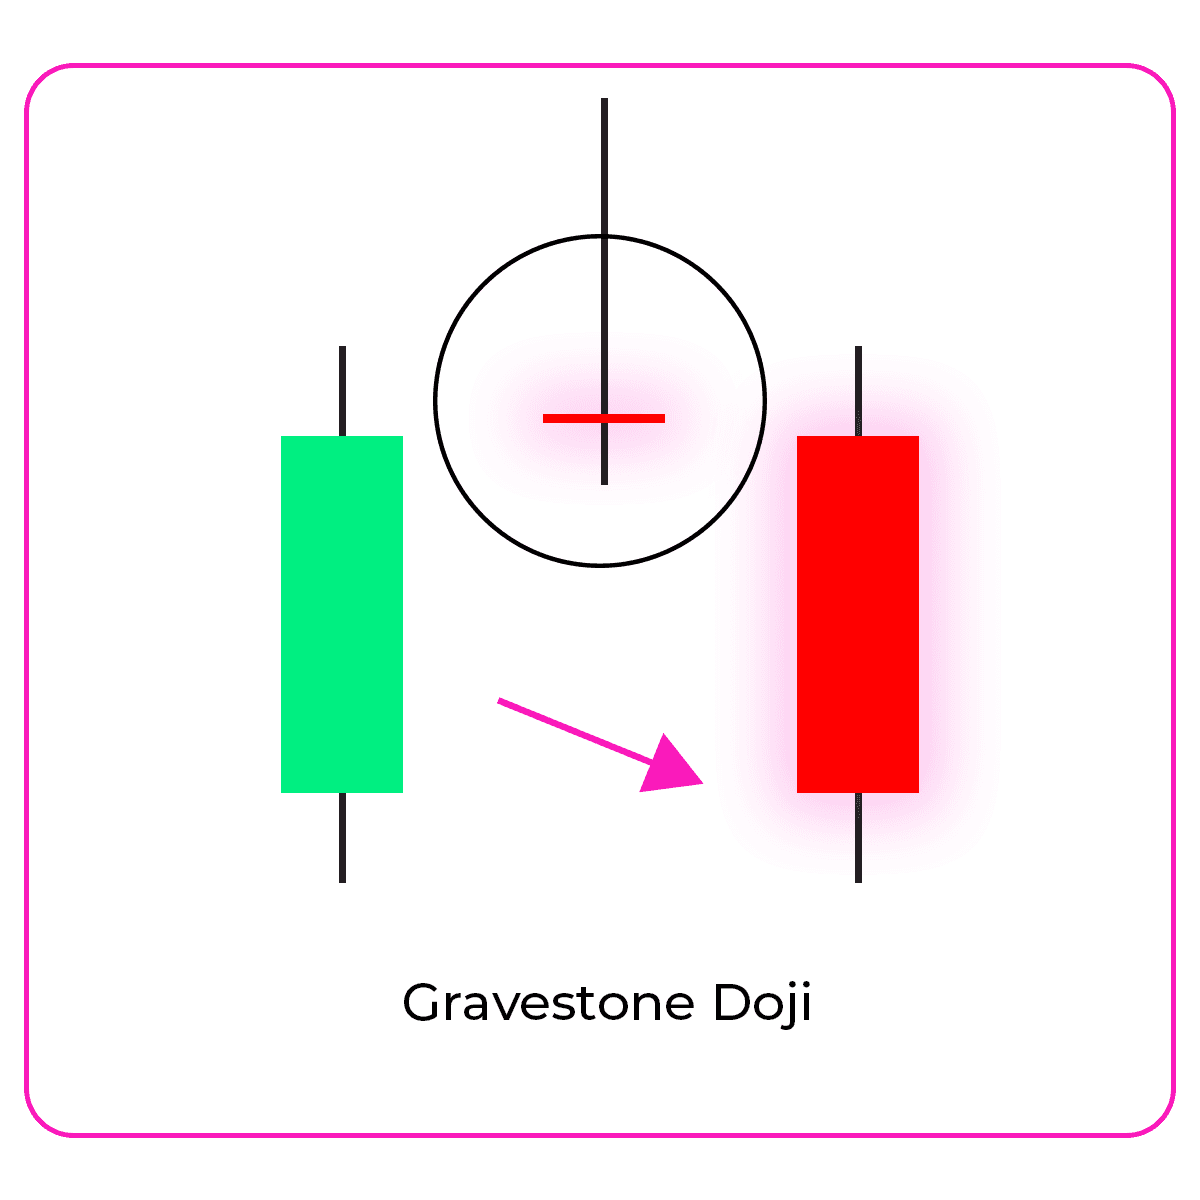
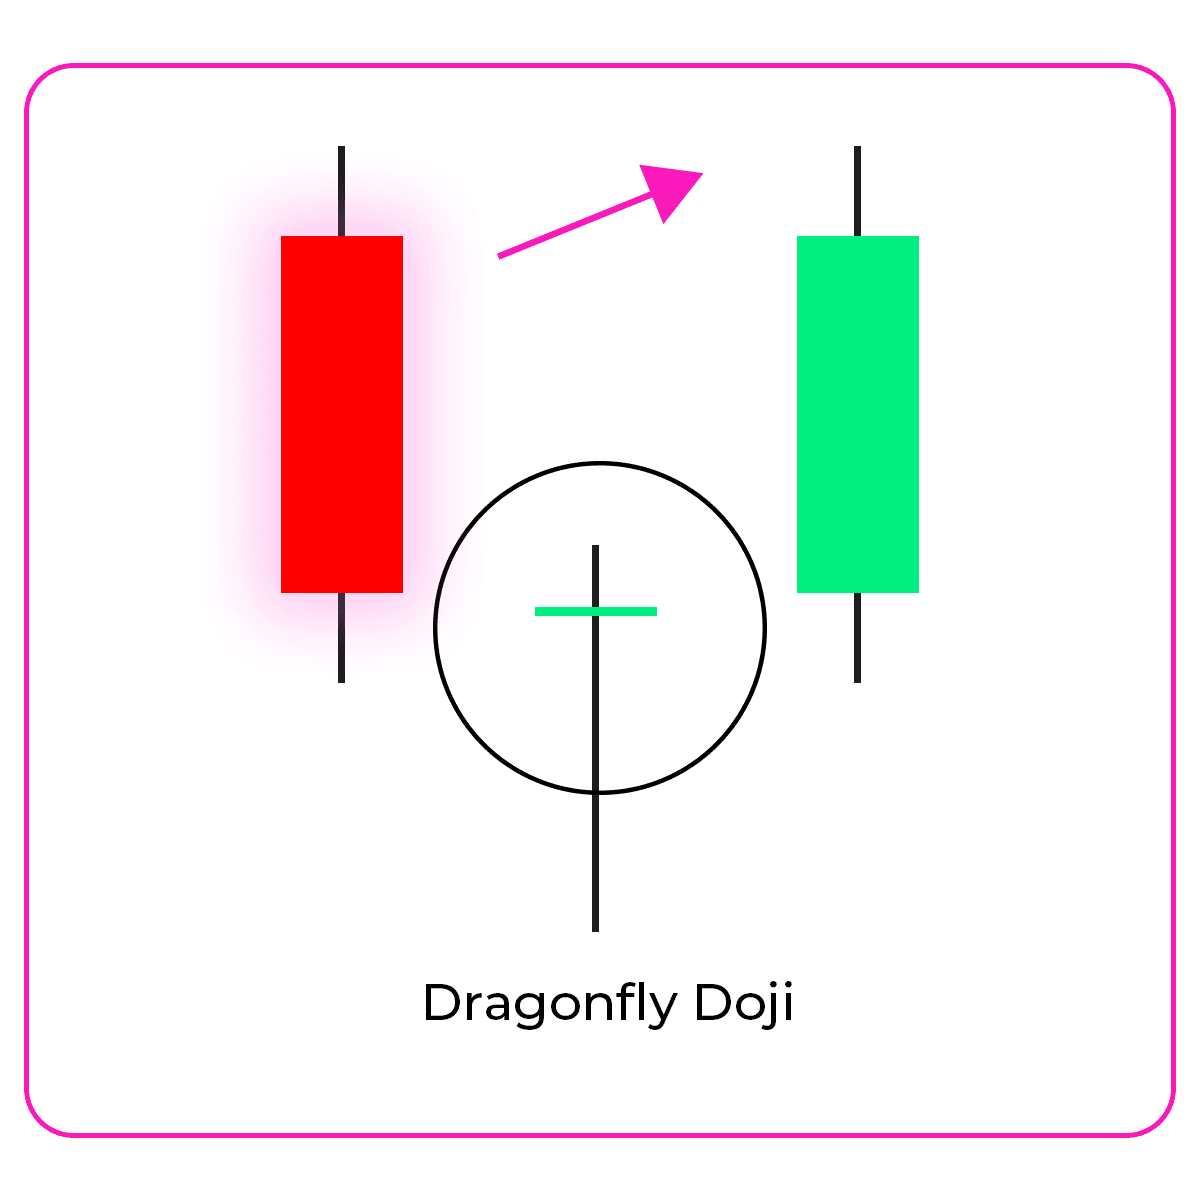
Doji
A candle with almost no body – open and close prices are nearly the same. It means the market has no clear direction.
How to trade it: A doji alone isn't enough. Wait to see what happens next. If a strong move follows, that's your potential signal.
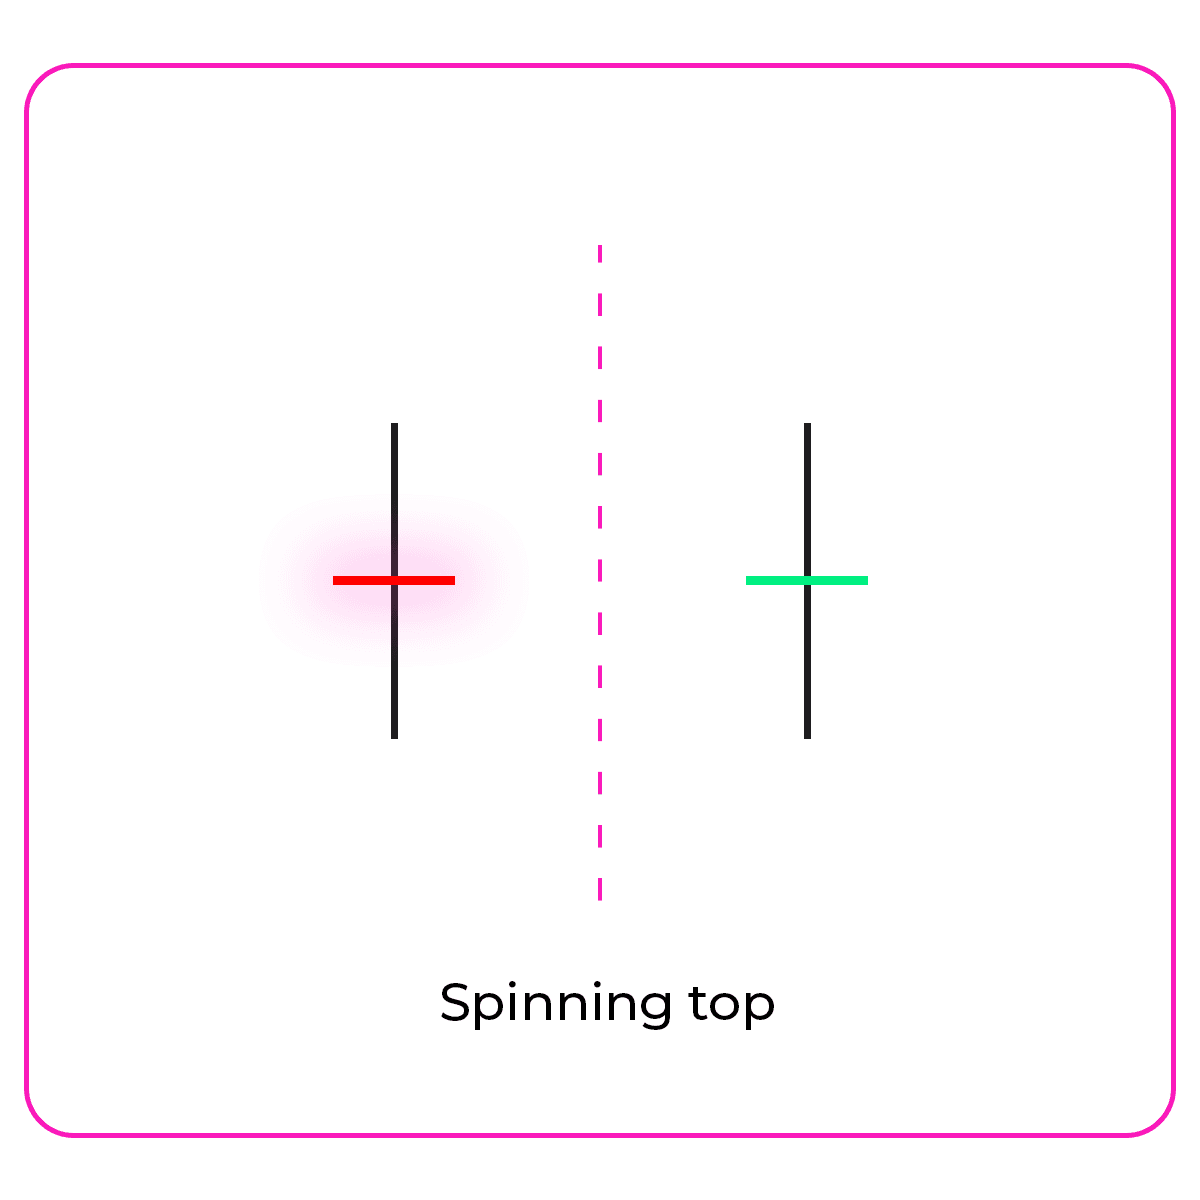
Spinning top
A candle with a small body and long wicks on both sides. Traders are hesitating. Often appears before a change in volatility.
How to trade it: Not a strong signal on its own. Watch the next few candlesticks to see if a clear trend emerges.
How to trade candlestick patterns: Strategy for beginners
Knowing the patterns is great – but it's not enough. To really use candlestick trading in the real world, you need a trading plan. A proper strategy based on candlestick chart analysis helps you make decisions with logic, not emotions. And that's rule #1 in trading.
- Pick the right market and timeframe
- Focus on specific candlestick patterns
- For buys: hammer, bullish engulfing, morning star
- For sells: shooting star, bearish engulfing, evening star
- Always wait for confirmation
- the next candlestick moving in the same direction,
- a spike in volume (if your platform shows it),
- a breakout from support/resistance,
- combination with another pattern (like a double top or bottom),
- or crossing of moving averages with the MACD indicator.
- Define your entry, stop-loss, and take-profit
- Entry point – usually after the confirmation candle closes.
- Stop-loss – for example, just below the hammer's wick or above a shooting star.
- Take-profit – either near the next resistance level or based on a 1:2 risk/reward ratio.
- Backtest and practice on a demo account
As a beginner, stick with forex pairs that are highly liquid – like EUR/USD, GBP/USD, or USD/JPY. These tend to respect candlestick patterns more consistently.
And when it comes to timeframes, go with the daily (D1) or 4-hour (H4) charts. The signals are clearer, and you won't feel rushed into a decision.
Don't try to memorize every forex candle pattern out there. Stick to the essentials:
💡 Fintokei tip
It's not about how many trades you make. It's about how solid your setup is. Fewer trades, smarter choices.
One candle doesn't guarantee anything. You need confirmation – an extra sign that your idea makes sense. That could be:
Every trade should have:
This keeps you in control – and control is what successful trading candlestick patterns is all about.
Before risking, test your strategy on past charts. Find places where patterns appeared. See what the market did next. Use a Fintokei free trial challenge to practice your entries, exits, and risk control – all without pressure.
Summary
If you made it this far – congrats! You've got a solid base to start using candlestick charts in your trading. It's not magic. It's all about observation, patience, and following a plan.
✅ Every candlestick tells a story – who was in control, where the market tried to go, and how traders reacted.
✅ Candlestick patterns aren't rules – they're signals of probability. They don't guarantee what will happen. They just hint at what might.
✅ The best candlestick patterns are simple, clear, and make sense in context. A hammer at the end of a downtrend means more than one in the middle of chaos.
✅ A forex candlestick is more than a visual – it's a window into market sentiment.
✅ Trading candlestick patterns should be part of your strategy. Just seeing them isn't enough – you need to know how to react.
FAQs
Is candlestick pattern trading suitable for passing a Fintokei trading challenge?
Yes, candlestick patterns are one of the core price action techniques you can use while working through a Fintokei challenge. A pattern alone isn't enough though — you also need confirmation, a clear trading plan, and disciplined risk management.
Which candlestick pattern is most reliable for beginners?
The most beginner-friendly patterns are the Hammer and Bullish/Bearish Engulfing — they're visually clear and show up fairly often. Reliability always depends on the context the pattern appears in, though, not just its shape.
How long does it take to learn to read candlestick charts?
The basic patterns (Hammer, Doji, Engulfing) can be recognized within a few days of watching charts. The real skill — placing a pattern correctly within the trend context and confirming it with other signals — takes weeks to months of practice to build, ideally starting on a free trial account. We recommend digging deeper with Fintokei's free ebook on chart patterns.
Are candlestick patterns enough on their own, or do I need confirmation?
A pattern alone is never enough. You always need confirmation — for example, the next candle moving in the same direction, a break of support/resistance, a spike in volume, or another pattern lining up alongside it. Without confirmation, you risk trading on false signals.
What's the best timeframe for reading candlesticks?
For beginners, the daily (D1) or 4-hour (H4) chart is recommended — the signals are less "noisy" there, giving you more time to decide. More experienced traders also use patterns on lower timeframes for scalping or intraday trading.
Do candlestick patterns work across all markets (forex, crypto, stocks)?
Yes, candlestick patterns are a universal technical analysis tool and work on forex, crypto, stocks, and commodities alike. Only the volatility and liquidity of the market change — the underlying principle of reading the patterns stays the same.
Unleash your trading potential on Fintokei accounts too!

As part of the support team, I help traders get the best possible experience at Fintokei. I trade myself: indices are my go-to. When markets close, I reset on the padel court or in front of a PC game. Favorite platform: cTrader. Favorite challenge: ProTrader.