The Story of the Hammer Candlestick Pattern
The Hammer candlestick pattern is one of the most well-known patterns in technical analysis. At first glance, it looks simple: a small body and a long lower wick. But its real value is not in the shape itself. It is in the story it tells about sellers, buyers, and the moment when the market refuses to move lower.

The Hammer Pattern as a Story of a Falling Market That Fought Back
Candlestick charts are not just a nicer-looking version of line charts. Each candle shows what happened in the market during a specific period. Where the price opened. How far it moved. Where it ran into resistance. And where it eventually closed.
That is exactly why Japanese candlesticks are so popular in technical analysis. They help traders read not only price action, but also market sentiment. Who had the upper hand? Buyers? Sellers? Or are both sides starting to even out?
And this is where the Hammer candlestick pattern enters the scene.
At first glance, it looks simple. A small body near the top, a long lower wick. But the shape itself is not the main point. What matters is what had to happen in the market for this candle to form.
The Hammer is the story of a market that first falls. But then, at lower prices, something changes.
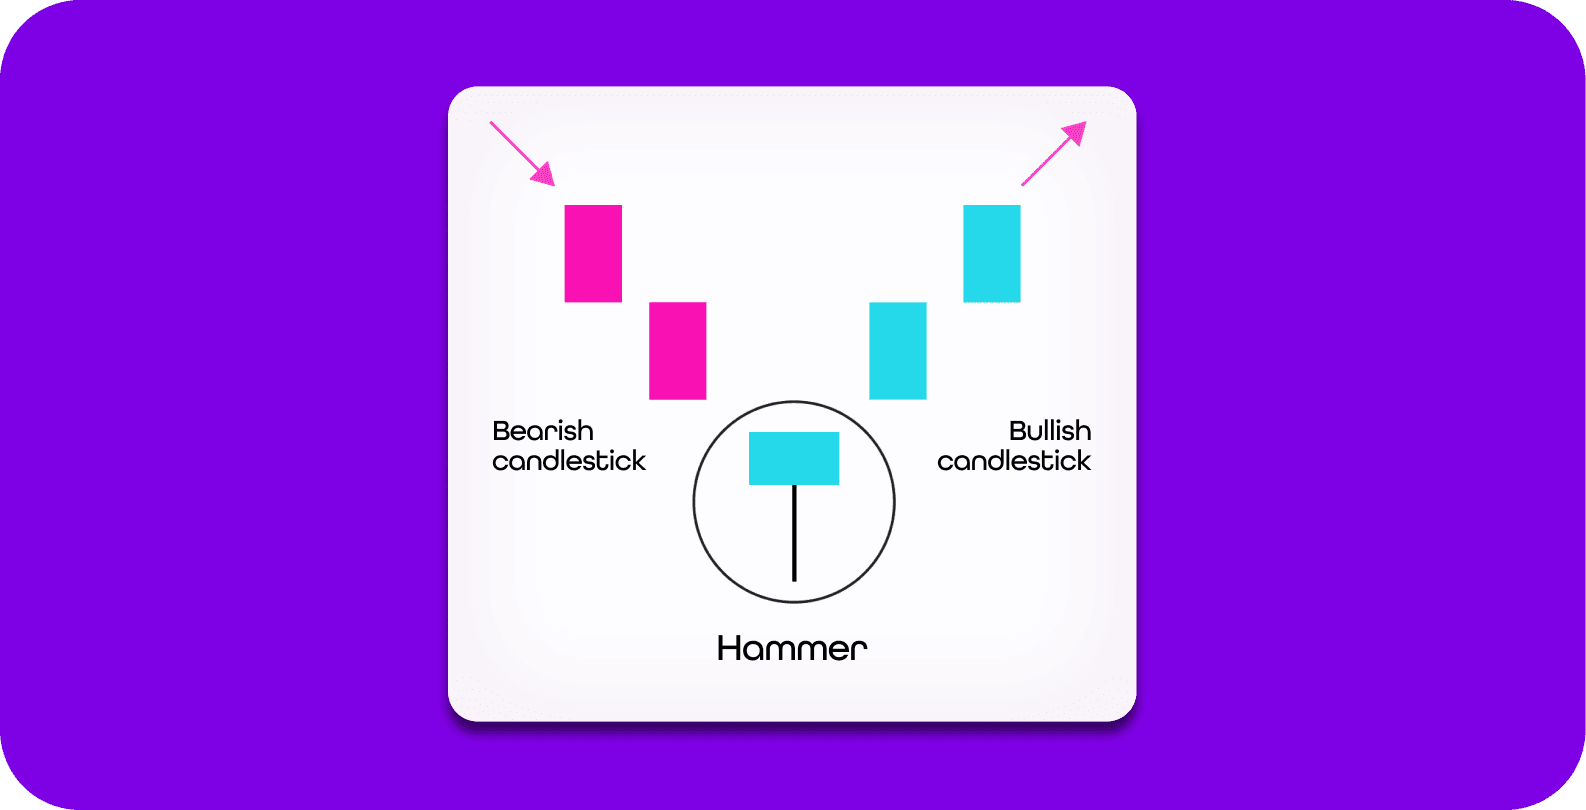
First, Sellers Take Control
The Hammer pattern makes sense mainly after a price decline. Without that previous move lower, it would just be a candle with a long lower wick. Not a true Hammer candlestick pattern.
Before the Hammer forms, the market is usually under pressure. Price is falling, sellers are confident, and buyers are cautious. Every small bounce may get sold quickly. Market sentiment is weak.
The situation may look like this:
- short sellers are in control,
- buyers are waiting for a better price,
- weaker long positions are capitulating,
- stop-losses below previous lows are under threat,
- most of the market expects the decline to continue.
This is an important part of the story. The Hammer does not appear in a calm market. It appears when things do not look good for buyers.
Then Bears Push the Price Even Lower
The Hammer candle itself often starts as another continuation of the decline.
Sellers push the price down. The market creates a new local low. At first, it may look like another confirmation of weakness. Traders already in short positions have a reason to feel confident. Traders holding long positions start getting nervous.
This is where the long lower wick begins to form — a trace of how far sellers managed to push the price.
Psychologically, this is the moment when bears try to break the market even lower. Late sellers often jump in here. They see the drop, fear missing the move, and enter short at a point where part of the selling pressure may already be exhausted.
The market is tense. Price is low. Emotions are high.
See an opportunity on the chart? Test your plan in a Fintokei Challenge.
But Lower Prices Start Attracting Buyers
And then comes the shift. At lower prices, demand begins to appear. This does not mean that everyone suddenly believes in a rally. It means that the balance of power is starting to change.
Some traders see a more attractive price. Others close short positions and take profits. There may be limit buy orders waiting around a support level. Sellers keep pushing, but the price no longer moves lower so easily. This is the core of the entire candlestick pattern.
The Hammer is not a candle where buyers were winning from the start. Quite the opposite. At first, they were under pressure. What matters is that they managed to come back.
The long lower wick therefore shows a rejection of lower prices. The market looked down — but it did not stay there.
And that is exactly why the Hammer pattern is one of the most recognized candlestick patterns. It is commonly described as a bullish reversal pattern that appears after a decline and may suggest that selling pressure is weakening.
The Most Important Part Happens at the Close
The price moves back up and the candle closes in the upper part of its range. That is why the Hammer has a small body near the top and a long lower wick.
At the beginning of the candle, it looked like another victory for sellers. By the end, the story looks different.
Sellers managed to push the price lower, but they could not keep it there. Buyers, on the other hand, showed that there was interest at lower prices. And that can shift market sentiment.
It does not mean the move is finished. It does not mean the market must immediately rise. But it does mean that the decline may no longer be as one-sided as it looked before.

Learn to trade other chart patterns too
They can tell you what the market is likely to do next. Want to trade like a pro? Mastering chart and candlestick patterns is the right way to get there!

What the Hammer Says — and What It Does Not Say
The Hammer is a powerful candlestick formation mainly because it can quickly show a change in market behavior. But it is still only one piece of technical analysis.
| The Hammer says | The Hammer does not say |
|---|---|
| Sellers pushed the price lower | The market will definitely reverse |
| Lower prices were rejected | A guaranteed bottom has formed |
| Buyers started coming back | It is time to buy immediately |
| Selling pressure may be weakening | A stop-loss is not needed |
| The market deserves attention | Context can be ignored |
This is important. The Hammer candlestick pattern is not a magic signal. It is a message from the market. And messages need to be read in full.
Context Matters More Than the Shape Itself
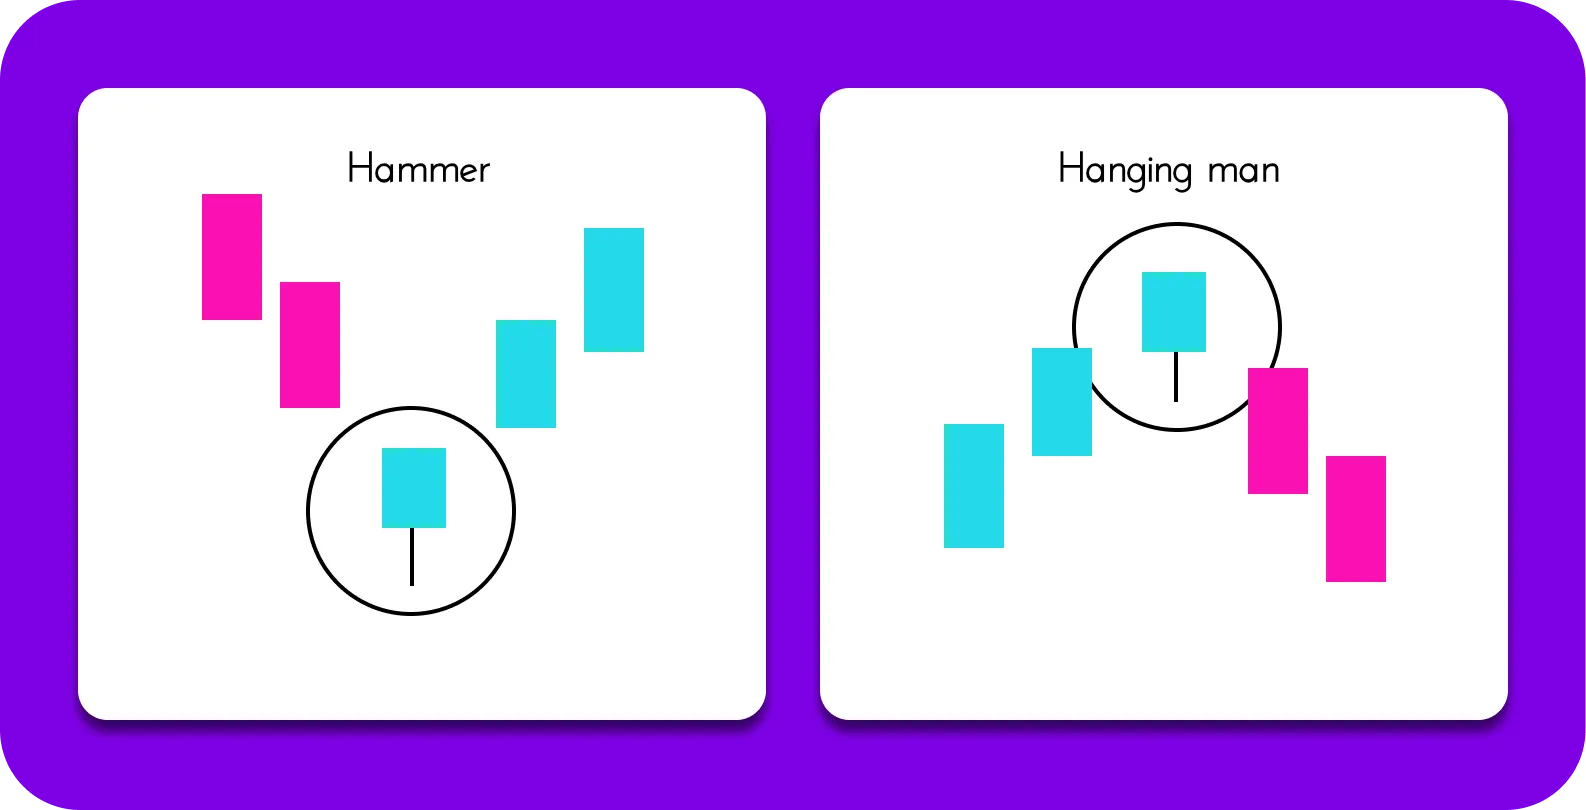
The same candle can have a completely different meaning depending on where it appears. After a decline, it may be a Hammer. After a rally, the same shape may resemble a Hanging Man, which has a completely different interpretation.
That is why the context of Hammer vs. Hanging Man is so important. The shape may be similar, but the meaning depends on the previous price movement.
💡 Fintokei tip
Here is a simple rule: A pattern is a sentence. Context is the whole paragraph.
A Hammer at a support level after a strong decline tells a different story than a similar candle in the middle of a sideways market. And a Hammer against a strong downtrend, without any follow-up from buyers, may be nothing more than a short pause before the market continues lower.
How to Trade the Hammer Candlestick Pattern
The Hammer is not a direct instruction to buy. It is a warning that market sentiment may be changing. But if you see it after a decline and you are considering a long trade, do not hit buy immediately. First, follow a simple process.
1. Check the Context
Start by asking where the Hammer formed.
A stronger signal usually appears when:
- the market had been falling before,
- the candle formed at a support level,
- price rejected a previous swing low,
- the pattern formed near an important psychological price,
- the same zone also makes sense on a higher timeframe.
A weaker signal appears:
- in the middle of a sideways market,
- without a clear support level,
- or against a strong downtrend.
In those cases, it is often not a real shift in sentiment. It may just be market noise.
2. Wait for Confirmation
Entering right after the Hammer candle closes may not be worth it.
Confirmation may look like this:
| Confirmation | What it means |
|---|---|
| The next candle closes above the Hammer high | Buyers maintained pressure after the pattern formed |
| Price breaks the high of the Hammer candle | The market confirms interest in higher prices |
| A higher low forms | Sellers failed to push price back to the low |
| The Hammer forms at support and price respects it | The level has a real market reaction |
| Volume is higher than usual | More market participants joined the move |
The goal is not to wait for everything at once. The goal is to avoid trading just the candle shape without any market reaction.
You do not need to wait for everything at once. The point is not to trade only the shape of the candle without any market reaction.
3. Plan Your Long Entry
If the Hammer formed in a logical place and the market confirmed it, a trader can start planning a long trade.
The three most common approaches are:
| Approach | How it works | Best suited for |
|---|---|---|
| Entry after the Hammer close | You buy right after the Hammer candle closes | More aggressive approach |
| Entry after a break of the Hammer high | You buy only when price breaks above the candle high | Balanced approach |
| Entry after a retest | You wait for price to return to support or the Hammer high | More conservative approach |
New to trading? Consider entering after the price breaks the high of the Hammer. This shows that buyers did not disappear immediately after the candle closed.
4. Place Your Stop-Loss Where the Story Stops Making Sense
With the Hammer pattern, the logical place for a stop-loss is usually below the low of the Hammer candle.
Why?
Because that low is the point where the market rejected lower prices. If price returns below that low and breaks it, the story of the pattern changes. Buyers are no longer defending the zone the way they should.
In practice:
| Stop-loss placement | Advantage | Risk |
|---|---|---|
| Just below the Hammer low | Smaller risk per trade | Higher chance of being stopped out by a wick |
| Below the support zone | More room for the market | Wider stop-loss, smaller position size |
| Below the nearest swing low | Better technical context | The trade may have a weaker risk-reward ratio |
Beginners should not try to place the stop-loss as close as possible just to open a larger position. A stop-loss should be placed where the trading idea stops making sense.
5. Find Your Take-Profit Before You Enter
Before entering a trade, you should already know where the first obstacle for further upside may be.
A take-profit level can make sense near:
- the nearest resistance,
- the previous swing high,
- a moving average,
- the upper edge of a range,
- a reasonable risk-reward ratio, for example 1:2.
If you risk 1 unit, the potential reward should make sense compared to that risk. If your stop-loss is 30 pips away and the nearest resistance is only 20 pips away, the trade may not be attractive — even if the Hammer looks good.
Unleash the power of TradingView now 💪
Crush your challenge with the most advanced platform on the market!
Why the Hammer Pattern Is Popular Among Traders
The Hammer pattern is easy to recognize. That is both its strength and its risk. The strength is that even a beginner trader can quickly understand the basic logic. Sellers pushed, buyers returned, and the market rejected lower prices. The risk is that traders then start seeing the Hammer everywhere. On every timeframe. In every correction. In the middle of every chart. But a good trader does not look only for the shape. A good trader looks for a story that makes sense. And that story appears only when the pattern fits into the broader market context.
What to Remember from the Story of the Hammer
The Hammer is one of the most well-known candlestick patterns in trading. Not because it can predict the future. But because it clearly shows a possible shift in market sentiment.
First, sellers take control. Price falls and sentiment is weak. Then, at lower prices, the market runs into buyers. The decline is rejected, and the candle closes near its high. That is the whole story.
The Hammer does not say:
“The market will definitely rise now.”
It says:
“Something changed here. Watch whether the market follows through.”
And that is how candlestick charts should be read. Not as a collection of shapes. But as a record of emotions, pressure, and decisions made by market participants. Because in trading, it is not just about seeing the pattern. It is about understanding why it formed.