The Story of the Doji Candlestick Pattern
There are moments when the market stops giving clear answers. No obvious winner. No dominant force. Buyers and sellers battle throughout the entire candle. And in the end, price returns exactly where it started. That is how the Doji candlestick pattern is formed. And in this article, we’ll show you how to read it correctly.
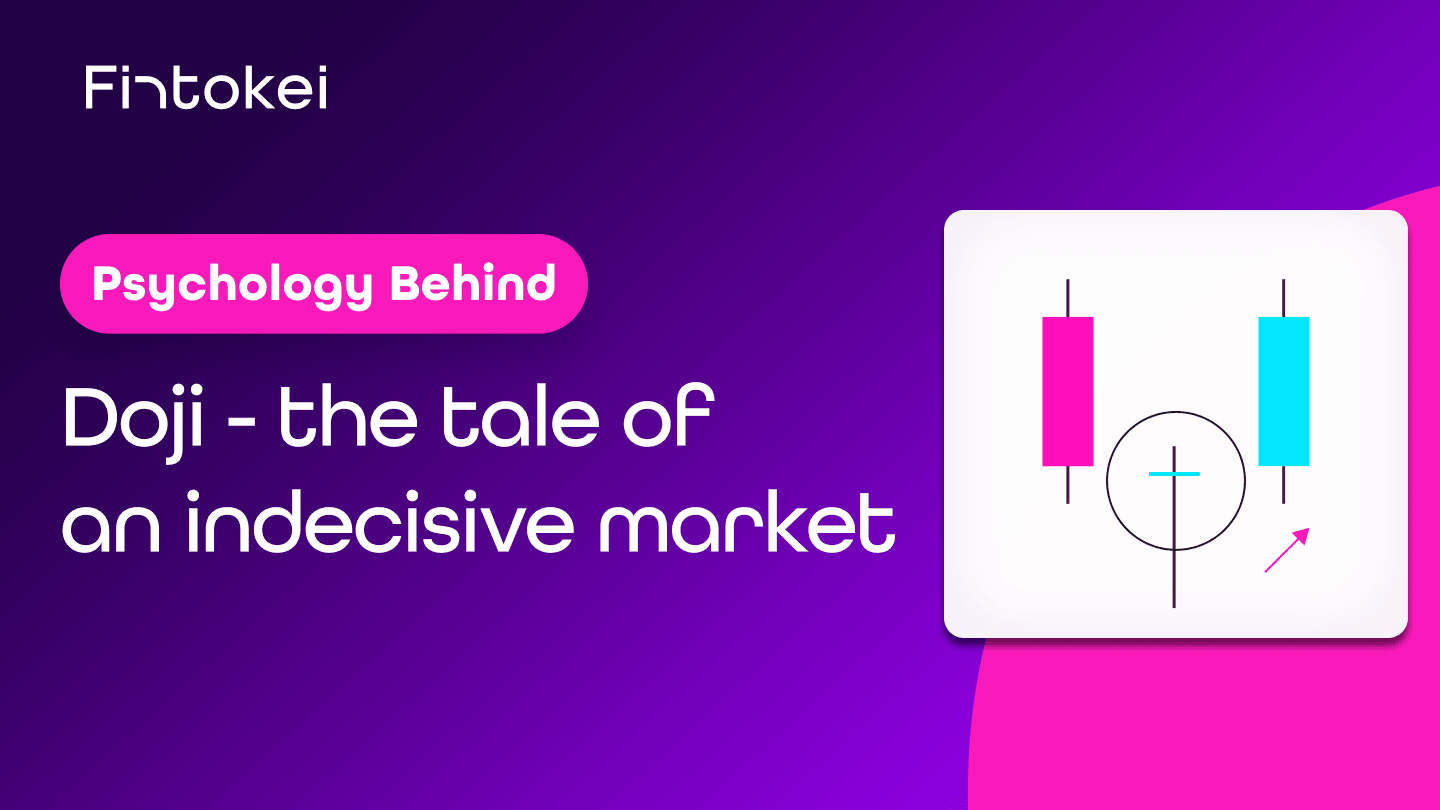
At first glance, the Doji looks subtle. A tiny or non-existent body, with wicks on both sides. But behind that simple shape hides one of the strongest signals Japanese candlesticks can offer: a moment of complete market indecision.
And that is exactly why traders watch it. Not because of what the Doji does on its own, but because of what may come after it.
But to read the Doji properly, recognizing it is not enough. You need to understand what is happening in the market, why the candle formed, and what it tells you. Because a Doji without context is just a candle with no body. With context, it can become one of the most valuable signals on the chart.
Doji as the story of an indecisive market
First, both sides have similar strength
Before a Doji forms, the market is usually not calm. Quite the opposite. Both sides are active.
Whether price had been rising or falling before, during the Doji candle, the balance of power becomes so even that neither buyers nor sellers can push their intention through. Price moves, the wicks get longer, but the candle body remains tiny. Or does not form at all.
That is the key point. A Doji is not born from apathy. It is born from a clash that ends with no winner.
Then the market tests both higher and lower prices
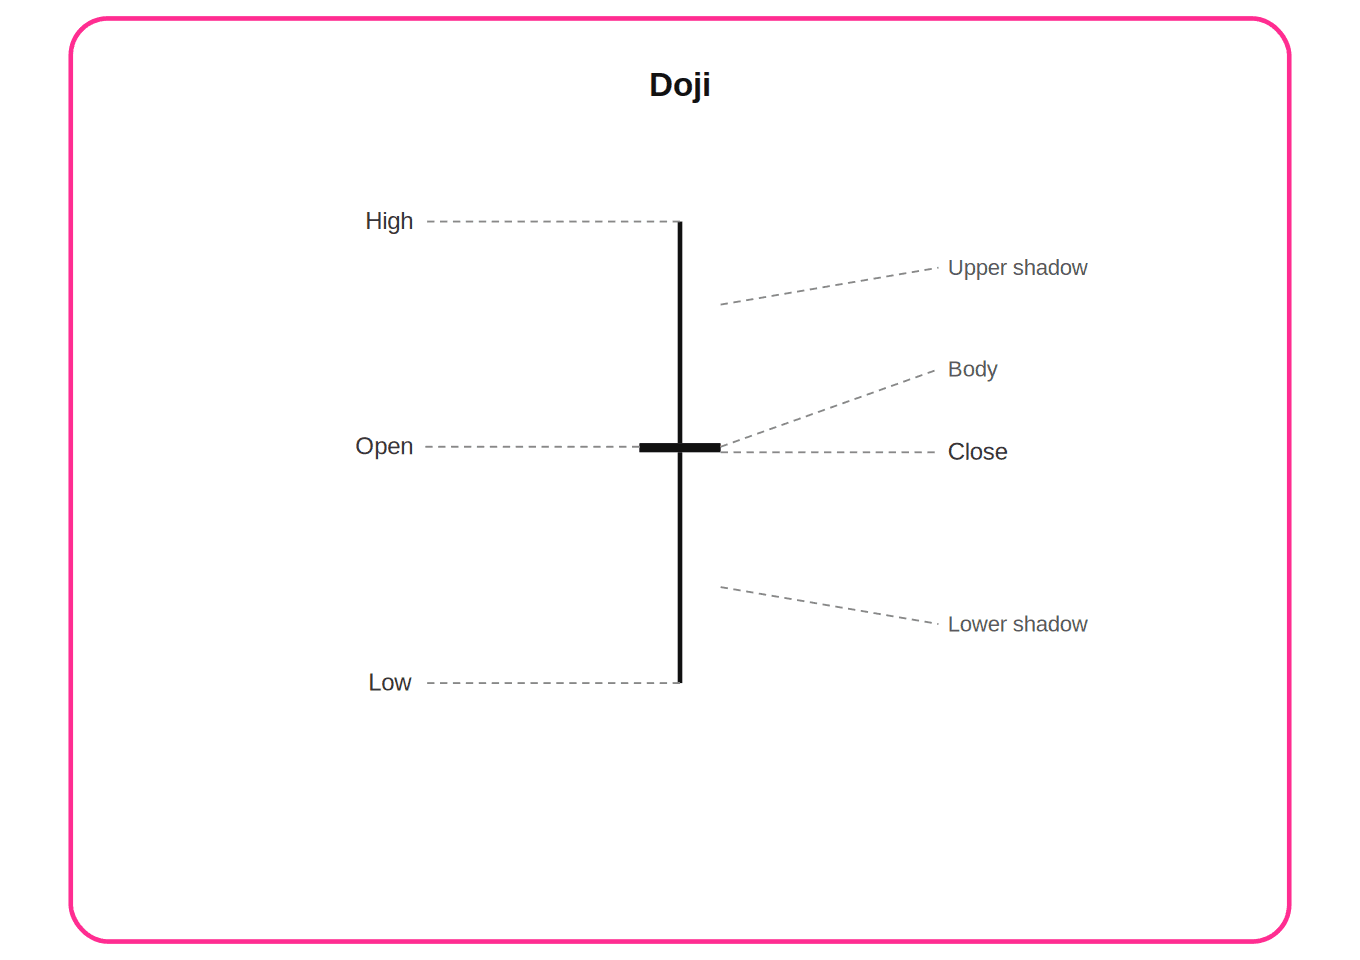
The formation of a Doji candle can look dramatic:
- The upper wick shows how far buyers managed to push the price.
- The lower wick shows how deep sellers managed to push it down.
And yet, the candle eventually closes near its opening price. As if the entire move was just a test of the terrain.
Psychologically, it is the moment when the market tests both sides and neither wins. Late buyers who bought high are disappointed. Sellers who shorted the move down realize that support is holding. The result is a stalemate.
But a stalemate does not mean calm. It means a decision is approaching.
This is where the Doji differs from a boring correction or random noise. A balanced candle at the end of a trend — or at a key price level — signals that the dominant side may be losing strength.
Sellers in a downtrend, or buyers in an uptrend, failed to push through. And that alone changes the mood of the market.
Traders notice it. Some close their positions. Others wait to see what comes next. Volume may change.
And it is precisely in this atmosphere of indecision that strong moves are born — once the balance finally breaks to one side.

Learn to trade other chart patterns too
They can hint at what the market is about to do next. Want to trade like a pro? Mastering chart and candlestick patterns is the right way to get there!
What the Doji tells us and what it does not
| The Doji tells us | The Doji does not tell us |
|---|---|
| Buyers and sellers are balanced | The market will definitely reverse now |
| The dominant side may be exhausted | A guaranteed bottom or top has just formed |
| The market tested higher and lower prices without a result | It is time to enter a position immediately |
| A potential directional decision is approaching | A stop-loss is not needed |
| The situation deserves attention and confirmation | Context and trend can be ignored |
See an opportunity on the chart?
Doji variants: not all Doji candles are the same
The Doji is not just one shape. There are several variants, and each one tells a slightly different story. The difference lies in where exactly the opening and closing prices are located, and how long the individual wicks are.
Standard Doji
The opening and closing prices are identical or very close to each other. The wicks are roughly the same length on both sides. This is the purest expression of indecision. The market moved up and down, then returned exactly where it started. It appears most often in sideways markets, but after a trend, at support or resistance, it becomes much more powerful.
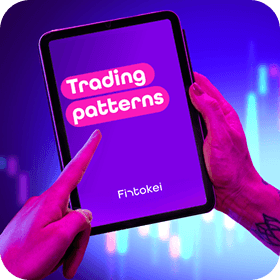
Long-Legged Doji
Extremely long wicks on both sides signal very high volatility and an intense clash between buyers and sellers.
The market moved far in both directions, but eventually closed near the middle. The longer the wicks, the more torn the market was — and the greater the potential tension before the next move.
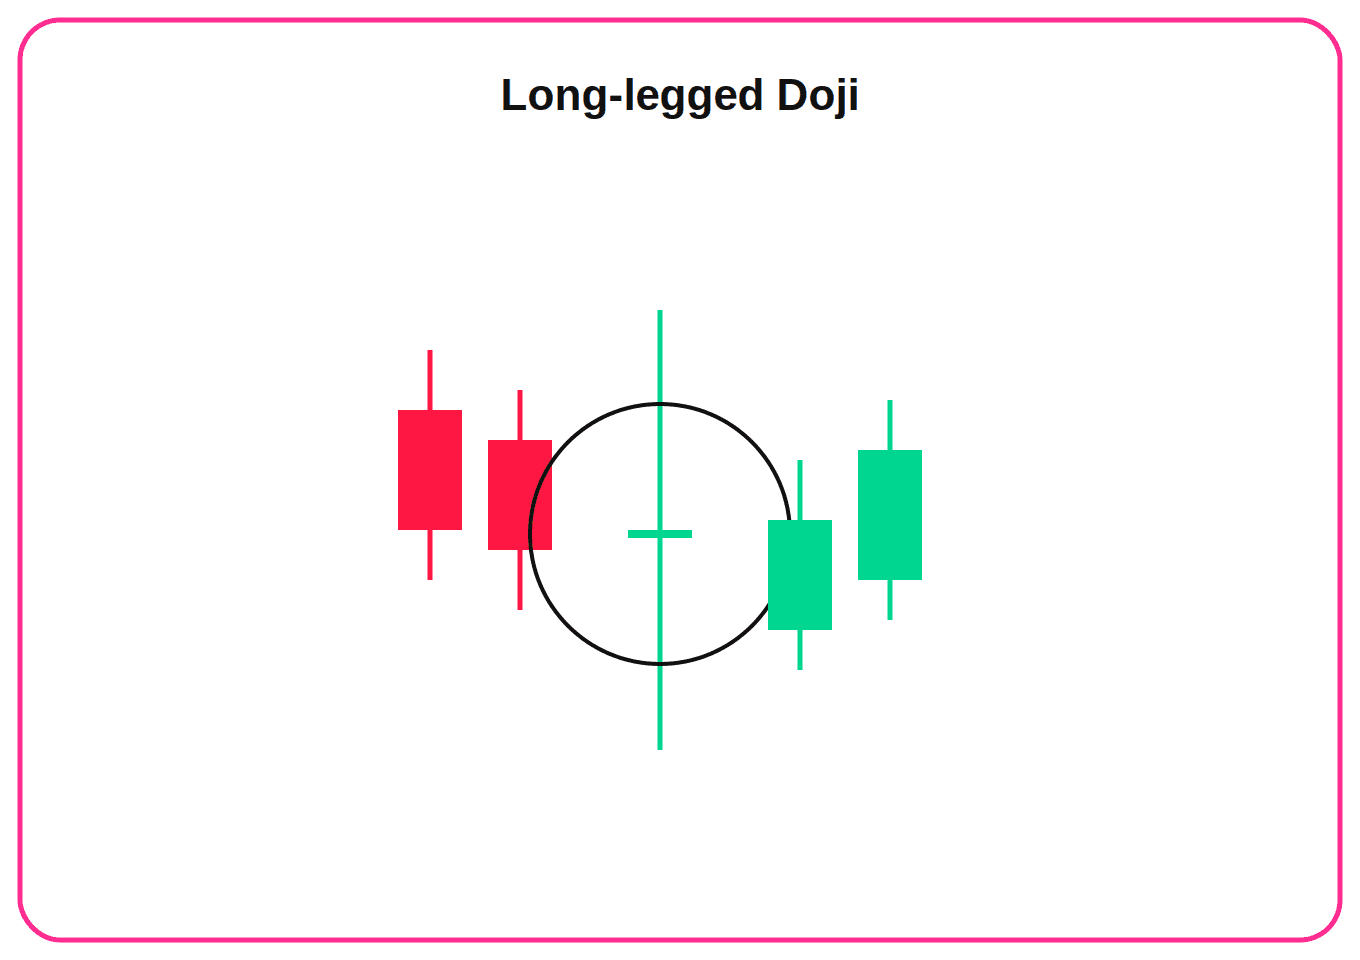
Dragonfly Doji
Technical definition: the open, high, and close are at the same or very similar level. The lower wick is long, while the upper wick is practically non-existent.
The story is clear: sellers pushed price significantly lower, but buyers absorbed the entire drop and brought price back to the opening level.
Watch the context:
A Dragonfly Doji is not automatically bullish. After a decline at support, it is one of the strongest bullish reversal signals. But after an uptrend or at resistance, it may signal the opposite: sellers are entering the market and buyers failed to hold higher prices. Always read the Dragonfly Doji in the context of the previous move.
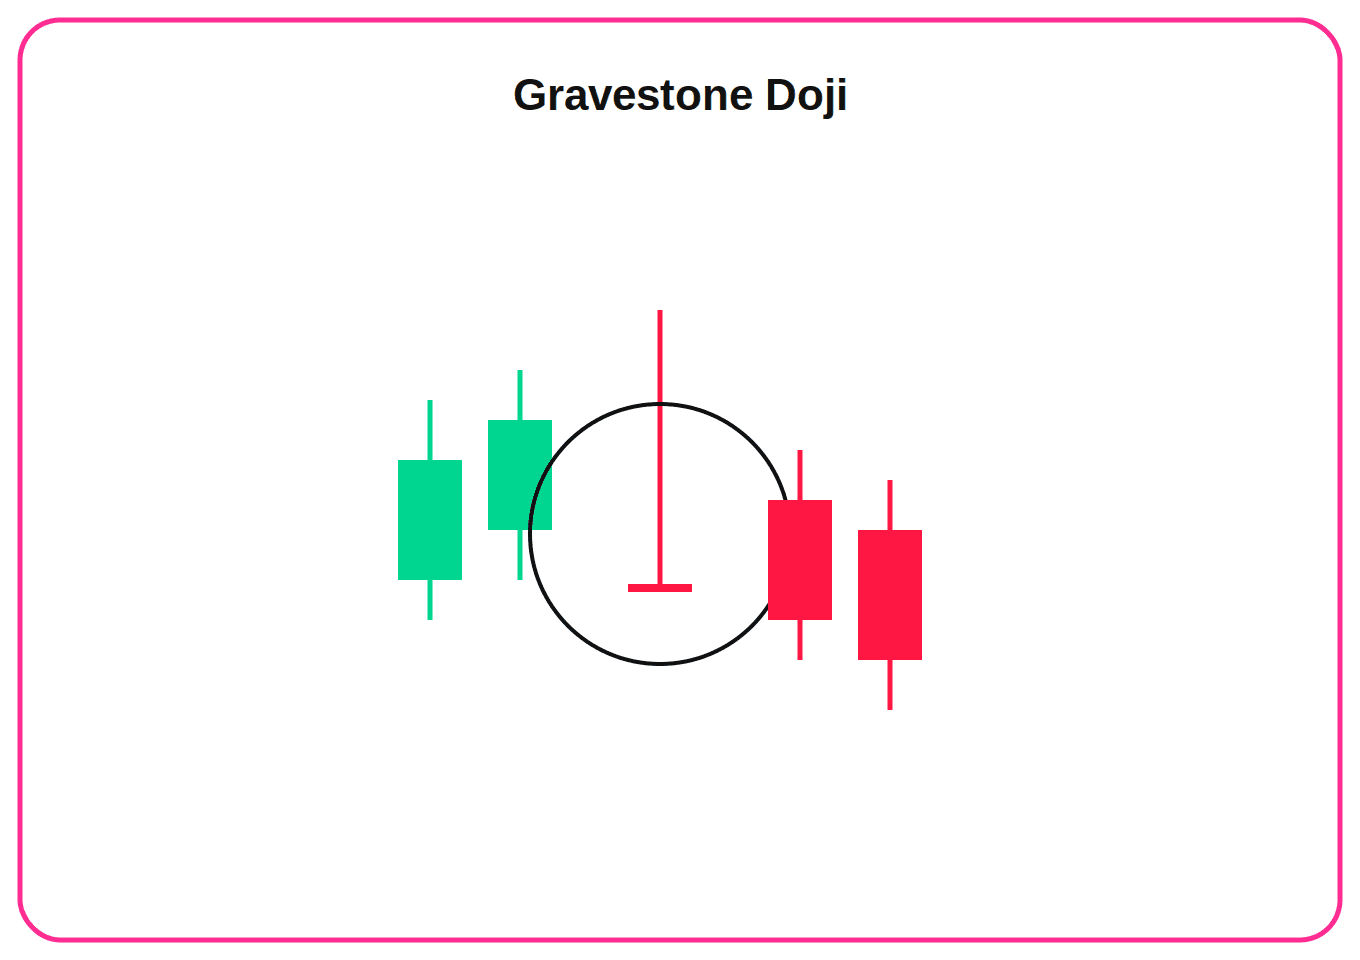
Gravestone Doji
The mirror image of the Dragonfly Doji. The opening and closing prices are near the low, while the upper wick is long. Buyers pushed price high, but sellers pulled it all the way back down. After an uptrend at resistance, this is a strong bearish signal. The buying pressure was fully absorbed.
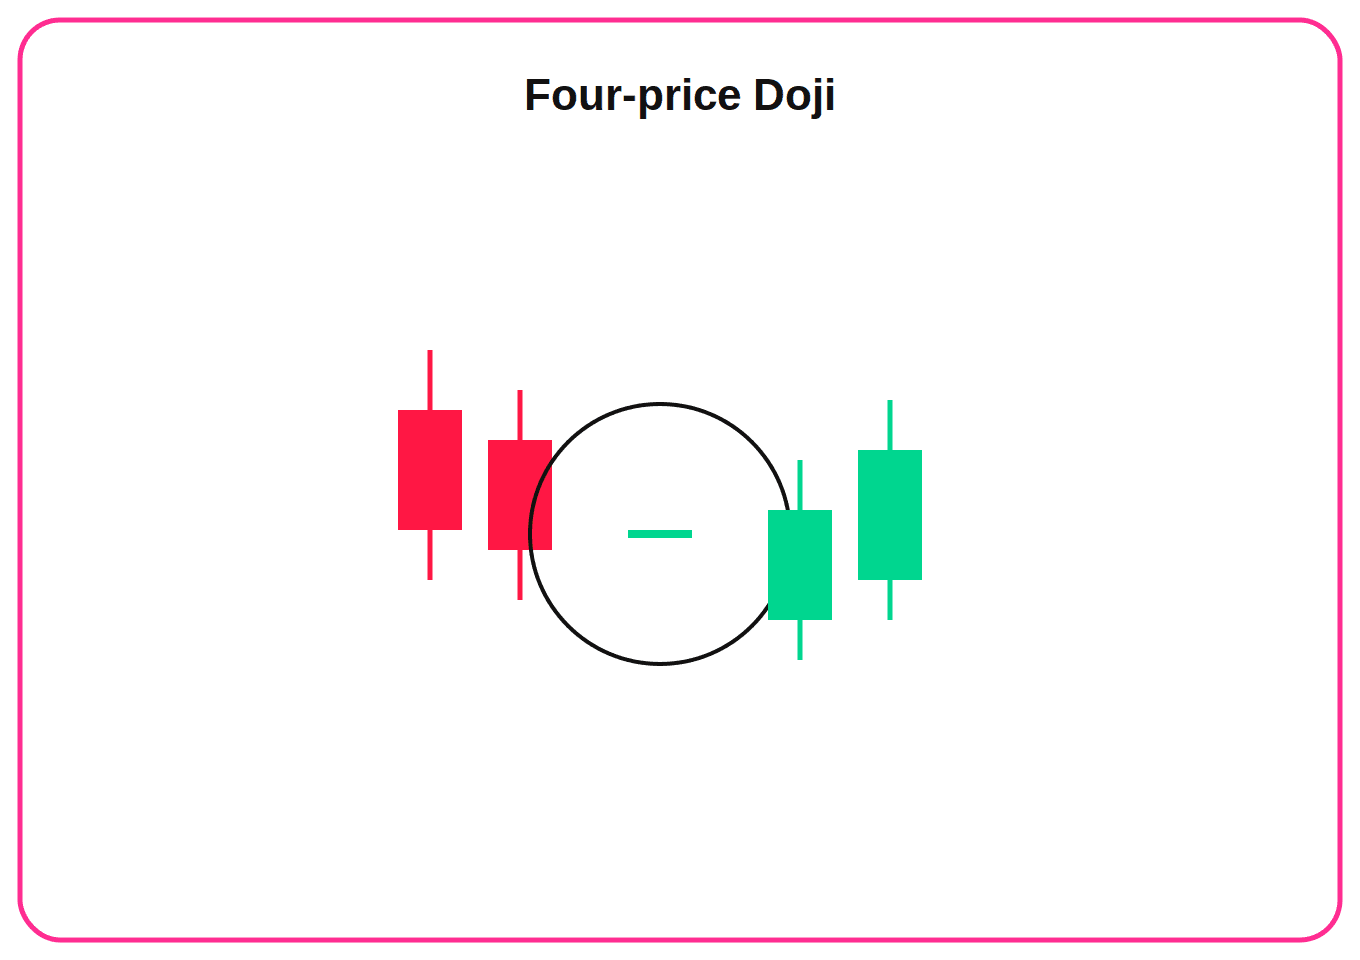
Four Price Doji
A rare variant where the opening price, closing price, high, and low are all the same. In practice, there is no movement. This is typical for markets with very low liquidity or the end of trading seasons. On its own, it does not have much analytical value. It is more of a technical artefact.
What not to confuse the Doji with
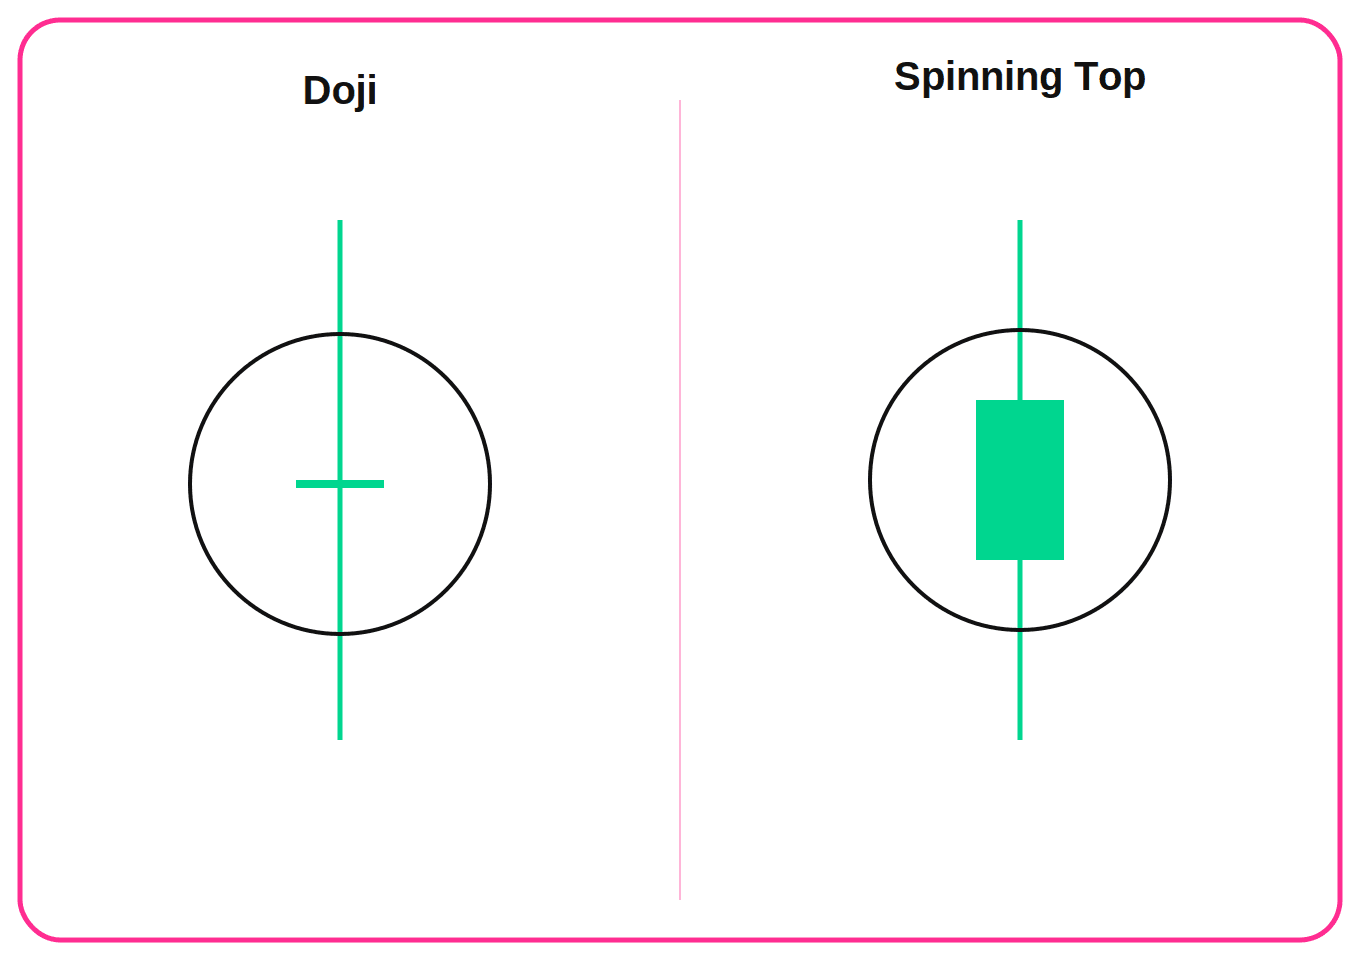
Doji vs. Spinning Top
Visually, they are very similar. Both have a small body and wicks on both sides. The difference lies in the size of the body: a Spinning Top has a visible body, even if small, while a Doji has a minimal or non-existent body. This difference is not just visual. It has practical impact. A Doji is generally a stronger reversal signal than a Spinning Top because it expresses a more perfect balance between buyers and sellers. A trader who confuses the two may be entering on a weaker signal without realizing it.
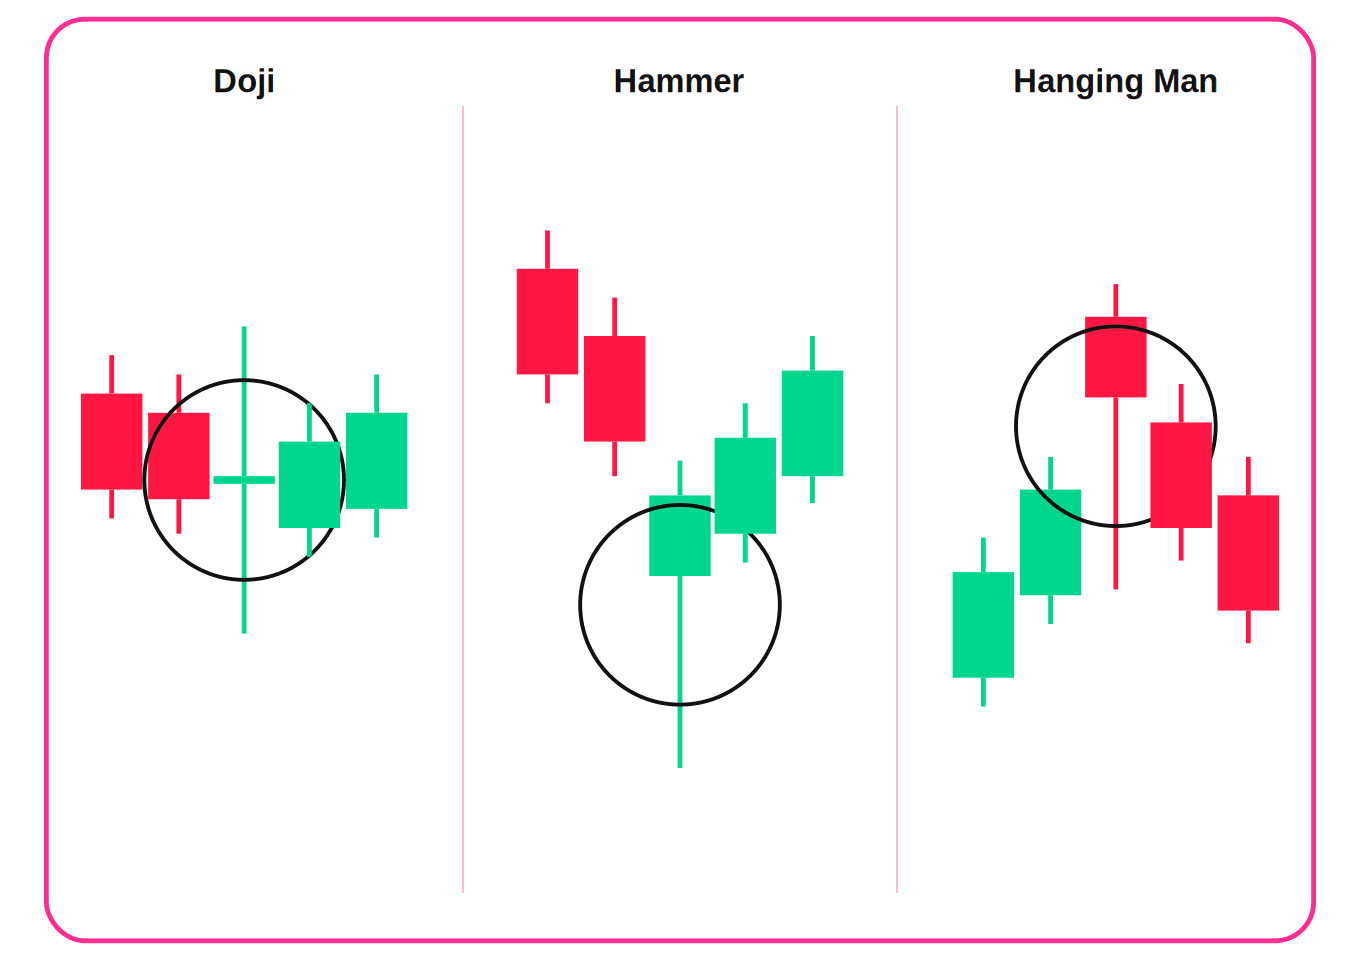
Doji vs. Hammer / Hanging Man
A Dragonfly Doji can visually resemble a Hammer after a decline, or a Hanging Man after a rise. The key difference: a Hammer or Hanging Man has a visible candle body. The opening and closing prices are not identical. With a Dragonfly Doji, they are practically the same. This confusion has a practical impact. A Dragonfly Doji after a decline is a stronger signal than a Hammer because buyers managed to fully neutralize the selling pressure.
💡 Fintokei tip
Also read the story of the Hammer candlestick pattern.
Doji vs. random noise on short timeframes
On a 1-minute or 5-minute chart, Doji candles appear very often. Not because the market is truly indecisive, but simply because not many trades took place during that interval.
The shorter the timeframe, the less reliable the Doji becomes. On M1 and M5, it is usually better to ignore it. On H1, H4, and higher, it starts to carry real analytical weight.
💡 Fintokei tip
Before every Doji, ask yourself: did it form after a strong move at a key level? If not, it is probably just noise — not a signal.
Which markets and timeframes does the Doji work on?
Forex
Forex is a natural environment for the Doji. High liquidity and continuous trading mean that indecision candles at key levels can carry real meaning. Especially strong signals often appear at the beginning or end of the Asian, London, or New York sessions, when market activity shifts.
Stocks and stock indices
The Doji works well on stocks and indices, especially on the daily and weekly timeframes. Shorter timeframes on stocks are more prone to noise because of lower liquidity outside the main session. On indices such as the S&P 500 or DAX, Doji candles on H4 and higher timeframes provide useful context for swing trades.
Commodities and gold
Gold and oil react well to Doji patterns because they are strongly influenced by market sentiment and fundamental events. A Doji at support or resistance on gold after a significant move is one of the more trustworthy setups.
Cryptocurrencies
Crypto markets are highly volatile, which means Doji candles appear extremely often on short timeframes — usually without any real analytical value. But on H4, daily, and weekly charts, Doji candles at key levels can be valuable because they reflect a real clash between major market players.
What trading symbols can be traded on Fintokei >
| Timeframe | Doji reliability | Comment |
|---|---|---|
| M1–M15 | Low | Mostly noise, too many false Doji candles |
| M30–H1 | Medium | Usable on Forex and indices, but requires strong context |
| H4 | High | A solid base for swing trades across all markets |
| D1 | Very high | The most reliable timeframe for Doji signals |
| W1 and higher | Extremely high | A weekly Doji at a key level is rare, but powerful |
💡 Fintokei tip
Not sure about the trading terms in this article? Check the glossary
How to trade the Doji candlestick pattern
A Doji is not an entry signal on its own. It is an alert.
But when you see it in the right place, it triggers a series of questions that can lead you to a trade with clear logic.
1. Check the context
First, ask yourself: where did the Doji form?
A random Doji in the middle of a sideways market has almost no value. A Doji at support after a strong decline, or at resistance after a rise, is a different story.
| Stronger signal | Weaker signal |
|---|---|
| Doji after a clear trend of at least 3–5 candles | Doji in a sideways market without a clear trend |
| Doji at support, resistance, or a key price level | Doji in the middle of a range without a technical level |
| Dragonfly or Gravestone Doji with clear asymmetry | Standard Doji on a short timeframe |
| Signal confirmed on a higher timeframe | Signal only on a low timeframe |
| Higher volume during the Doji formation | Average or lower volume |
2. Wait for confirmation
With the Doji, confirmation is even more important than with many other patterns.
Because the Doji does not tell you where the market will go. It only tells you that the market is uncertain. Confirmation is the candle or move that makes the decision.
| Type of confirmation | What it means |
|---|---|
| The candle after the Doji closes strongly in the reversal direction | The market has chosen a side, and the entry is justified |
| Break of the Doji high for a long, or Doji low for a short | Momentum confirms the direction |
| A higher low forms after the Doji in a downtrend | Sellers are losing pressure |
| Doji + volume spike | Bigger players entered the move |
3. Plan your entry
| Approach | How it works | Best suited for |
|---|---|---|
| Aggressive — entry after Doji close | You enter immediately after the Doji candle closes | Experienced traders with clear context |
| Balanced — entry after confirmation candle | You wait for the next candle to close in the reversal direction | Recommended approach for most traders |
| Conservative — entry on retest | You wait for price to retest support or resistance after the first move from the Doji | Traders with lower risk tolerance |
4. Stop-loss
The Doji provides clear logic for stop-loss placement: below the Doji low for longs, above the Doji high for shorts.
If the market breaks this zone, the story of the pattern no longer applies. Sellers or buyers have returned with strength, and the Doji was just a false signal.
| SL placement | Advantage | Risk |
|---|---|---|
| Tight below/above the Doji wick | Small risk, better RRR | The market may wick you out and then reverse |
| Below/above the whole price zone, support, or resistance | More room for the market | Larger stop-loss, smaller position |
| Below nearest swing low / above nearest swing high | Strongest technical logic | SL can be very far on volatile markets |
5. Take profit
For trades based on a Doji setup, look for take profit around the nearest obstacles:
- Nearest resistance for longs, or support for shorts
- Previous swing high or swing low
- Fibonacci retracement levels, such as 0.618 or 1.0 projection
- Minimum RRR of 1:1.5 — ideally 1:2 or higher
💡 Fintokei tip
If the distance from the Doji to the nearest resistance is smaller than the distance from the Doji to the stop-loss, the trade is probably not worth it, even if the setup looks good. Not sure what RRR means? This article will explain it.
How not to trade the Doji
Do not enter immediately after the Doji closes without confirmation
Indecision does not mean the market will reverse. A Doji can simply be a pause before the trend continues. Without a confirmation candle, you are trading only the shape — not the story.
Do not ignore the trend
A Doji after a decline at support in a downtrend is interesting. A Doji in the middle of a strong uptrend at a random place is noise. Always know what trend you are in — and interpret the Doji in that context.
Do not overvalue Doji candles on short timeframes
On M1, M5, and M15, Doji candles appear all the time. They are not signals. They are often just artefacts of low volume or pauses in trading. If you trade intraday, look for Doji candles on M30 at the earliest — and preferably on H1.
Do not confuse the Doji type with context
A Gravestone Doji at strong support after a long decline is a different situation than a Gravestone Doji at resistance after a short move. The name of the variant tells you something about the psychology of the candle, but it does not create an automatic entry. Always read the whole situation.
Do not place the stop-loss too tight
Doji candles often have wicks that reach into nearby zones. A stop-loss placed too tightly below the Doji low can easily get hit by volatility before the market turns in the right direction. It is usually better to place the SL a few pips lower and use a smaller position than to get kicked out of a good trade too early.
What to take away from the story of the Doji
The Doji is not about what has already happened. It is about what has not happened yet. Every Doji candle is a moment when the market has not yet decided where it wants to go. Buyers and sellers are balanced, the move is aggressive in both directions, but neither side has won.
A Doji by itself does not say: “A reversal is coming now.” It says: “There is tension here. Watch what comes next.” And that is exactly how every trader should read it: as a message, not as an instruction.
It is not just about recognizing the Doji on the chart. It is about understanding why it formed and what it says about the balance of power in the market at that specific moment.