The story of the engulfing candlestick pattern
Buyers, or sellers? The engulfing formation decides that in a single candle. So read on and learn how to identify one of the most important candlestick patterns in technical analysis.
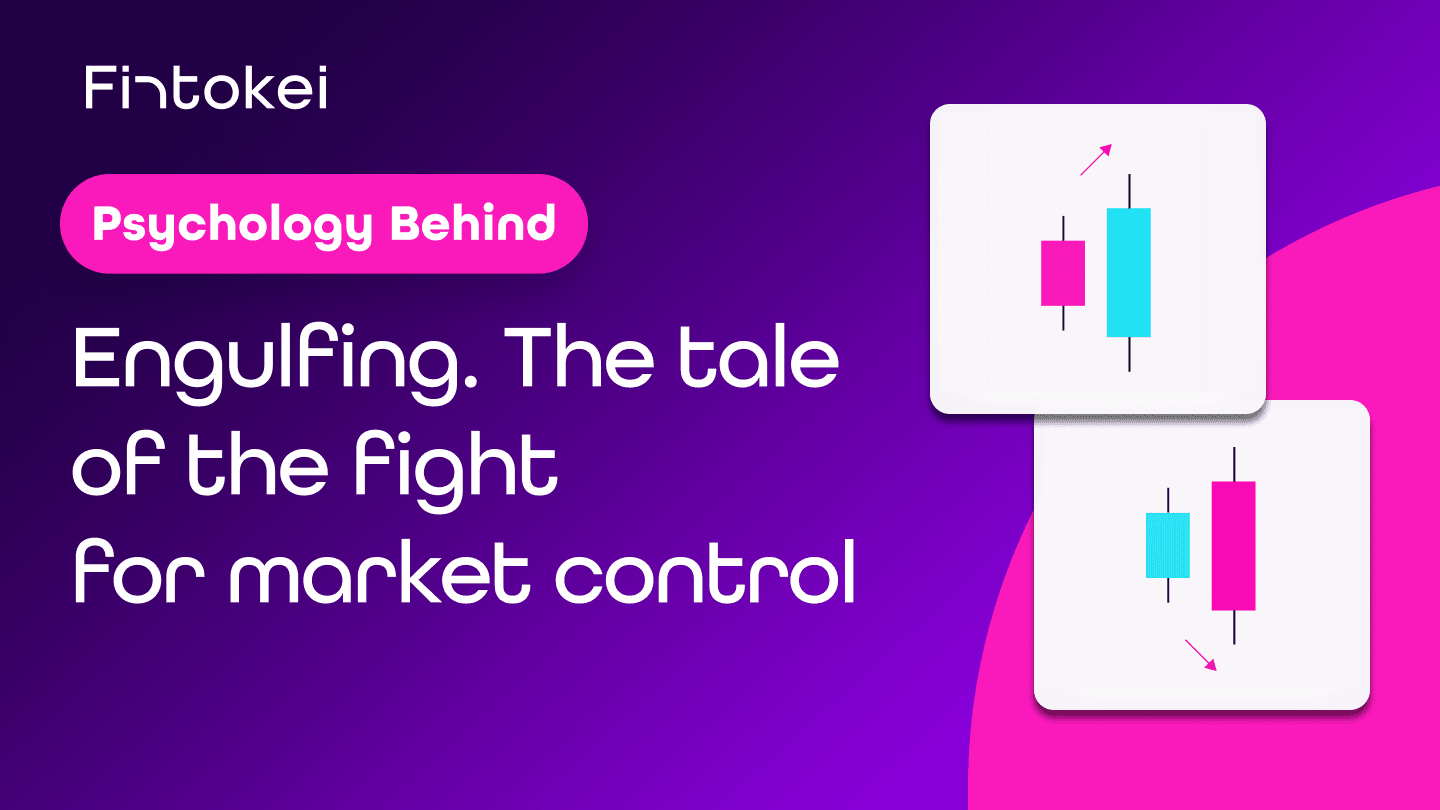
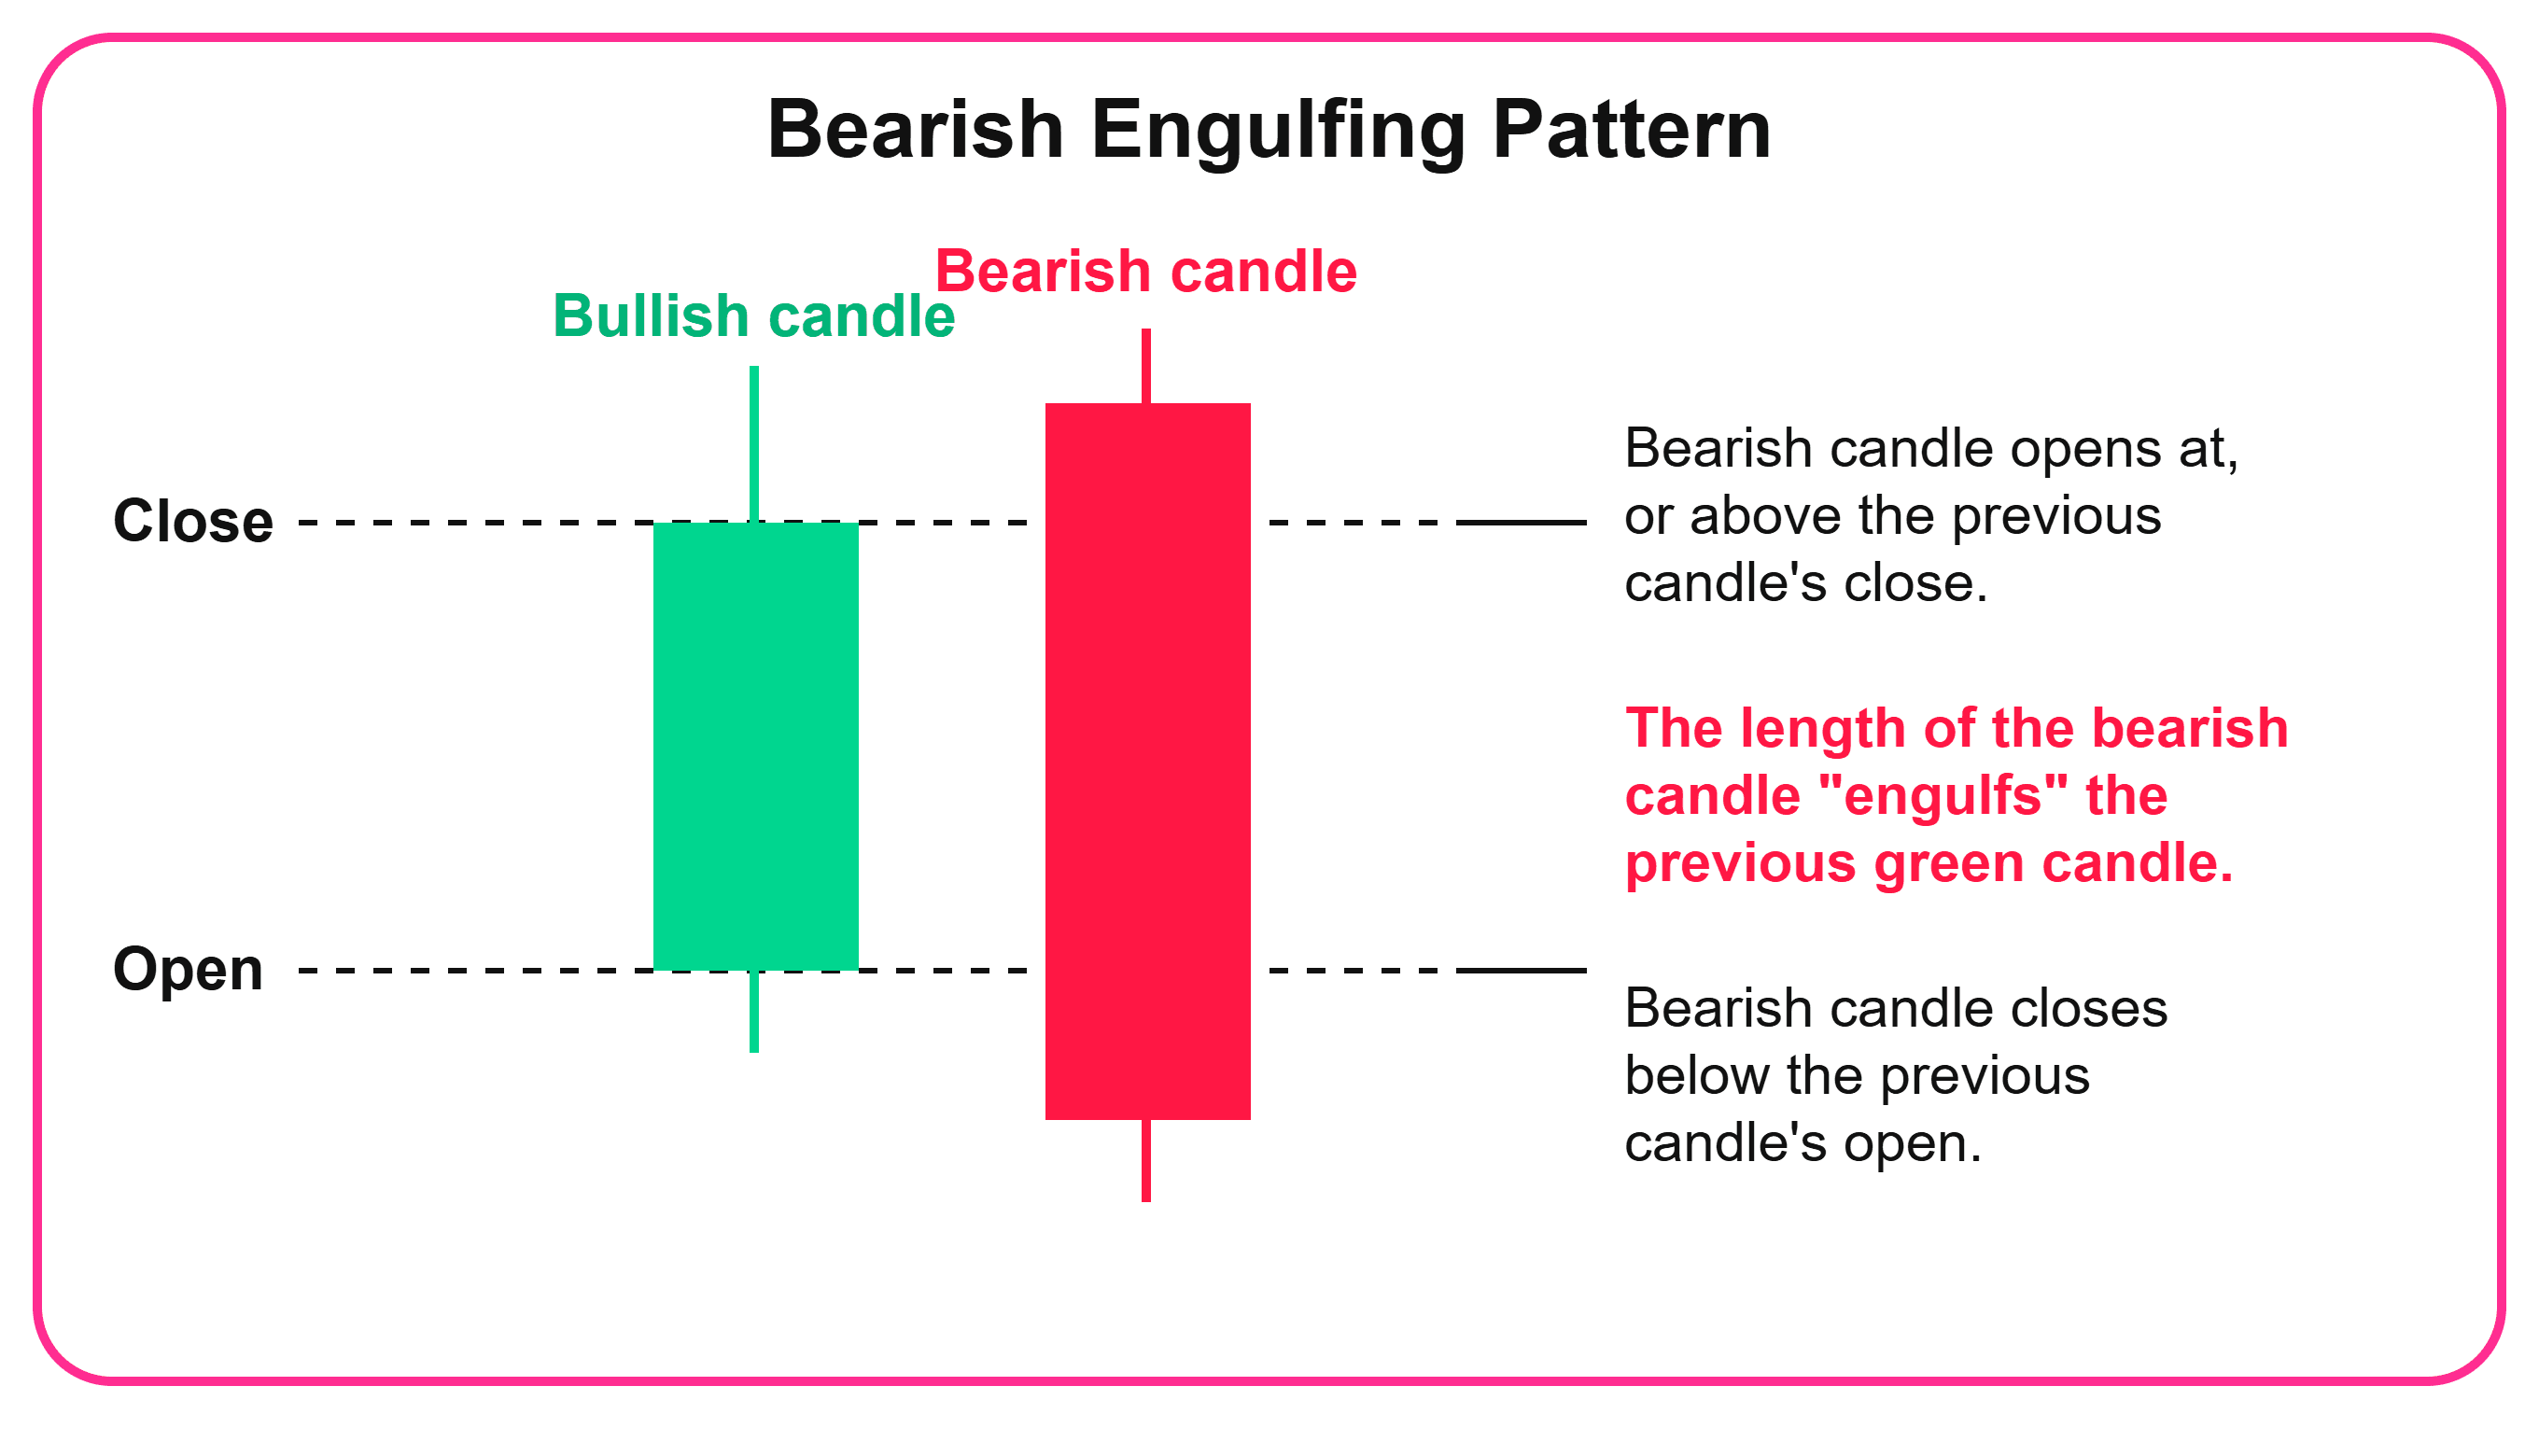
One candle does its job. It opens, pushes the market, closes, happy with itself. Then the next one eats it whole. 🍽️ It opens beyond that body, closes beyond it, and swallows it on both sides.
That's engulfing. It's one of the few patterns you get at a glance, no jargon needed. Which is exactly why people underestimate it. They see two candles, one bigger than the other, and jump straight into a trade. But engulfing has rules, some tricky look-alikes, and real limits.
Let's get into it. 🚀
Engulfing as a story about who's in control
First, one side is winning
In a downtrend, sellers are in charge. Price keeps sliding, calm, no drama. The last candle before the turn is small and red; selling pressure is running out of steam, though nobody knows that for sure yet. (Flip it around for an uptrend with buyers and a green candle: that's your bearish setup.)
Then the other side pushes back
The next candle can even open lower. But during that session, buyers step in hard enough to close the price above where the previous, smaller candle opened. The new candle's body has fully outgrown the old one. Add higher volume on top, and you're looking at real interest, not a fluke.
And here's the twist
Sellers who bet on the drop suddenly find the price back above their entry. Some of them close out at a loss, and that only adds more fuel to the upward move. It's this forced capitulation, not the candle's size, that gives engulfing its punch.

Learn to trade other chart formations
They can give you a clue about what the market is likely to do next. Want to trade like a pro? Mastering chart and candlestick patterns is the right path!

What engulfing tells you, and what it doesn't
Engulfing variants: not all created equal
Bullish and bearish engulfing
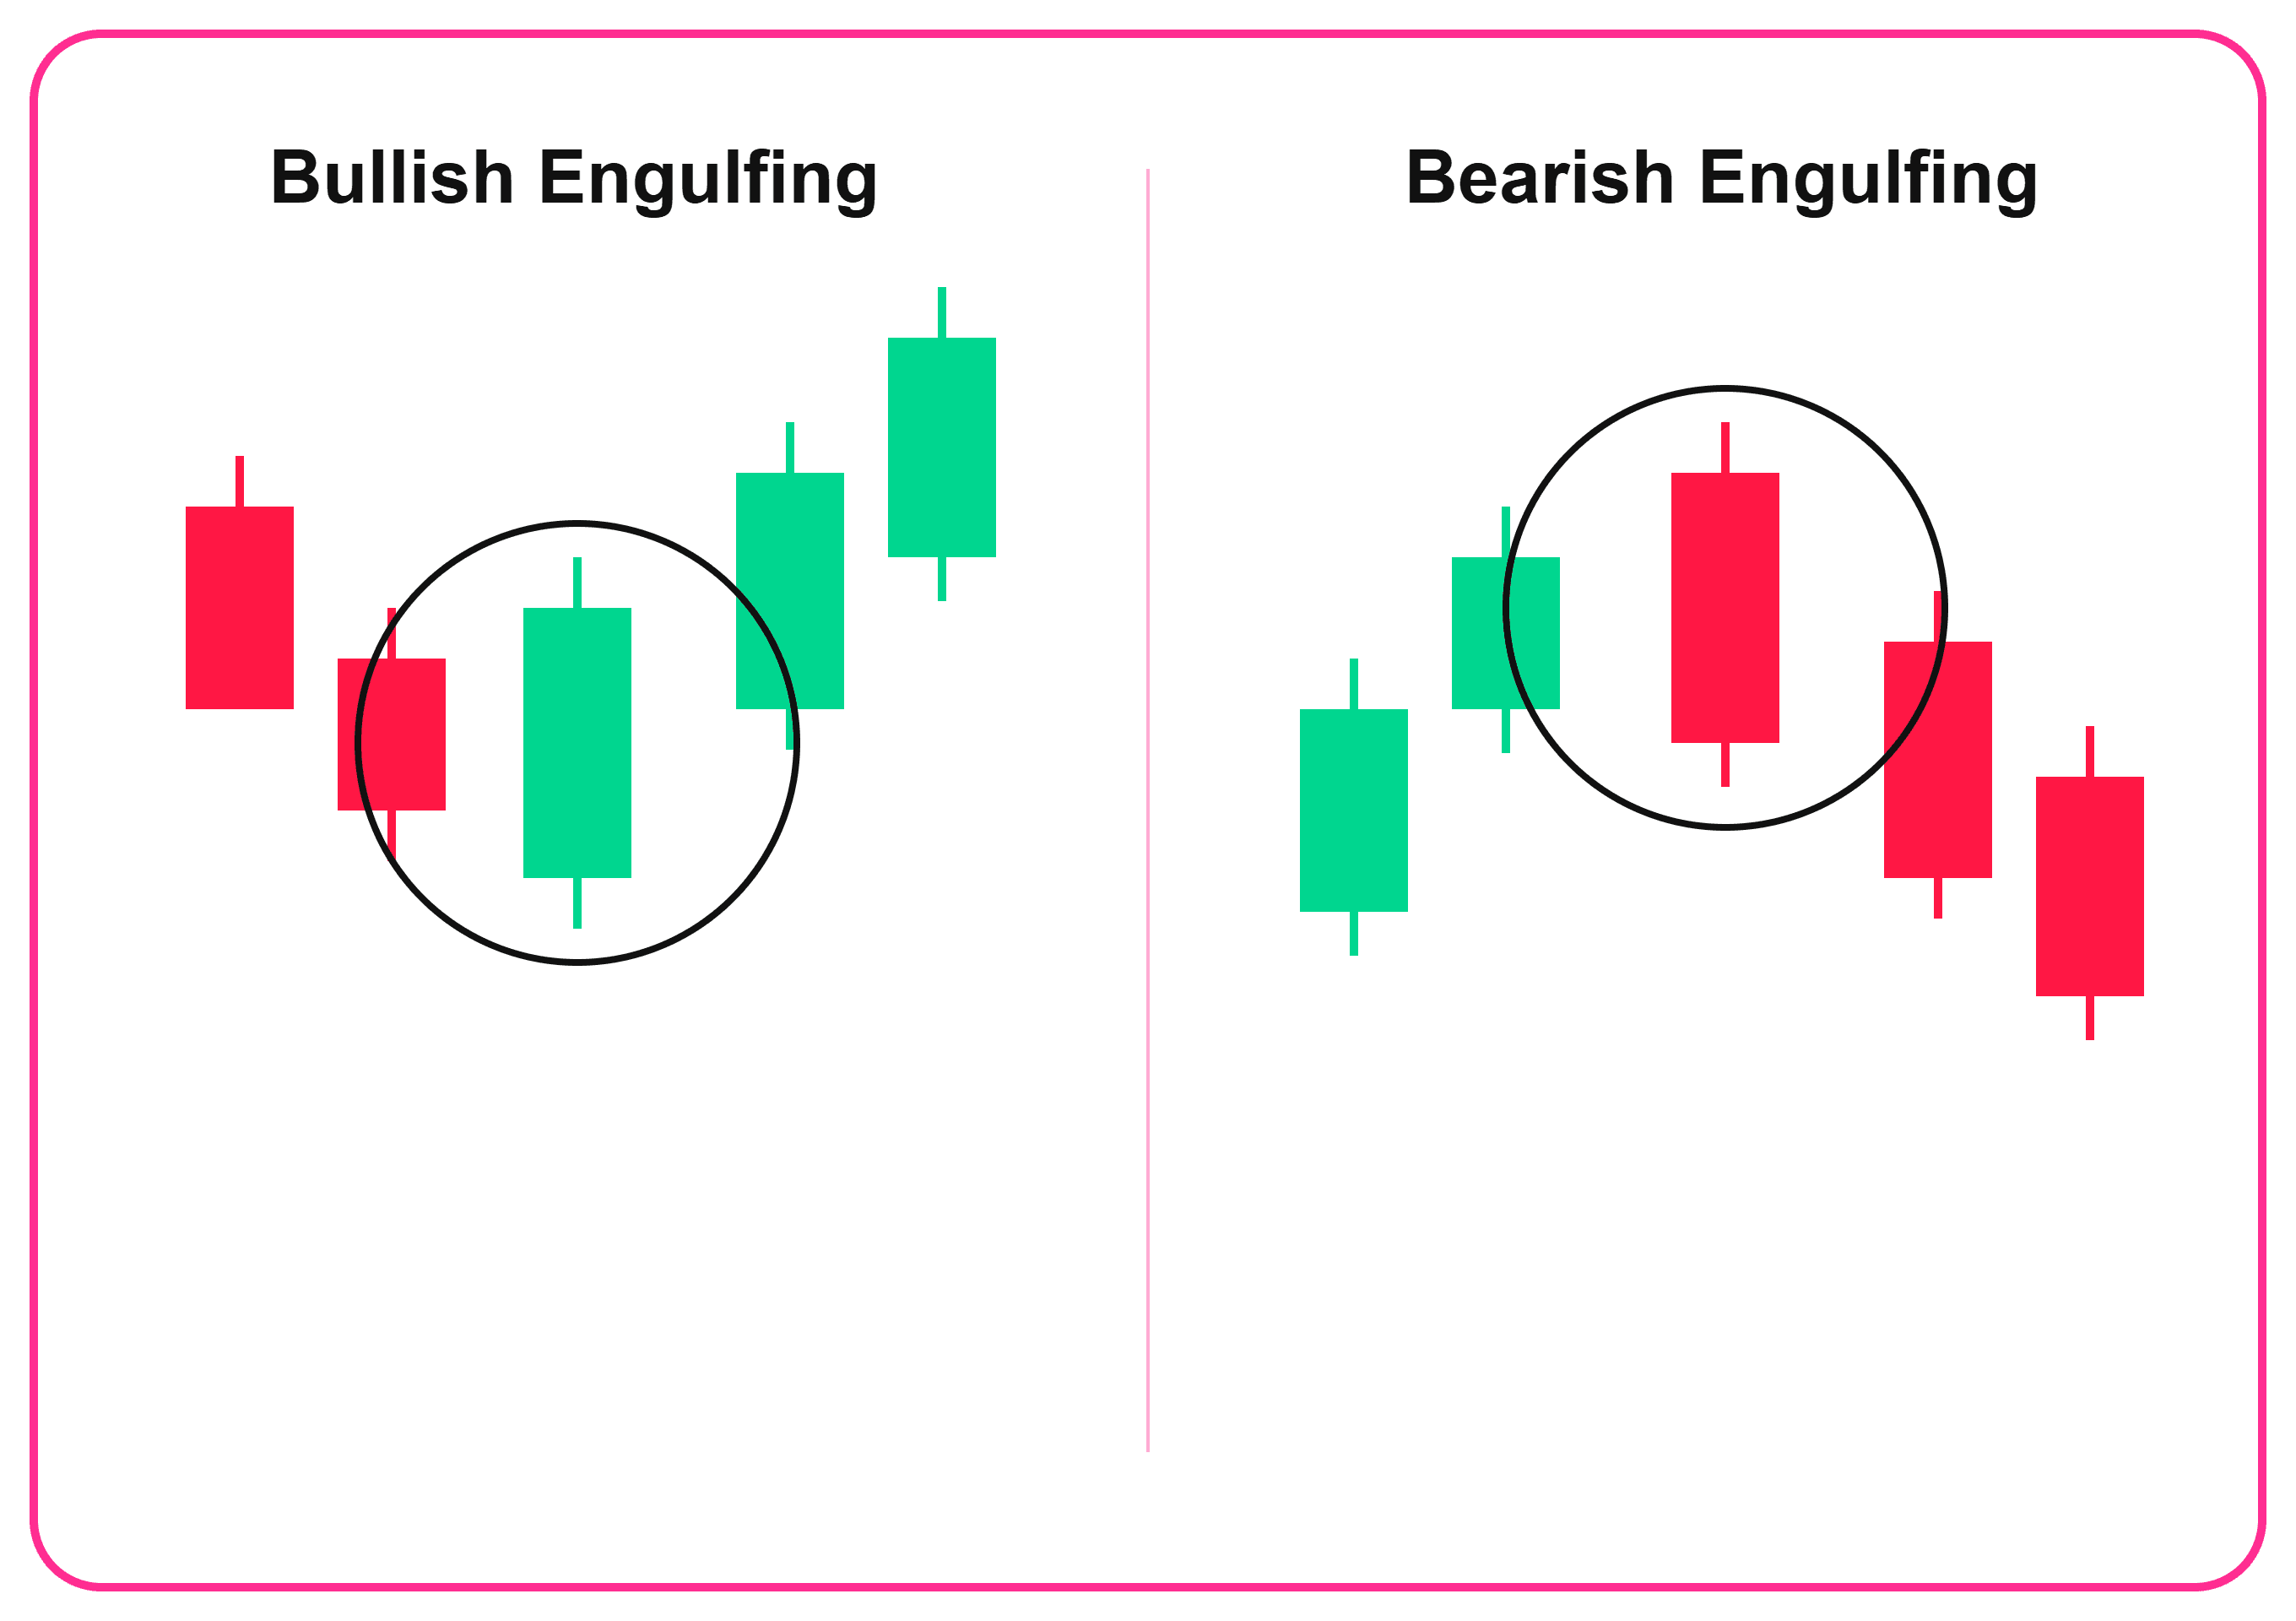
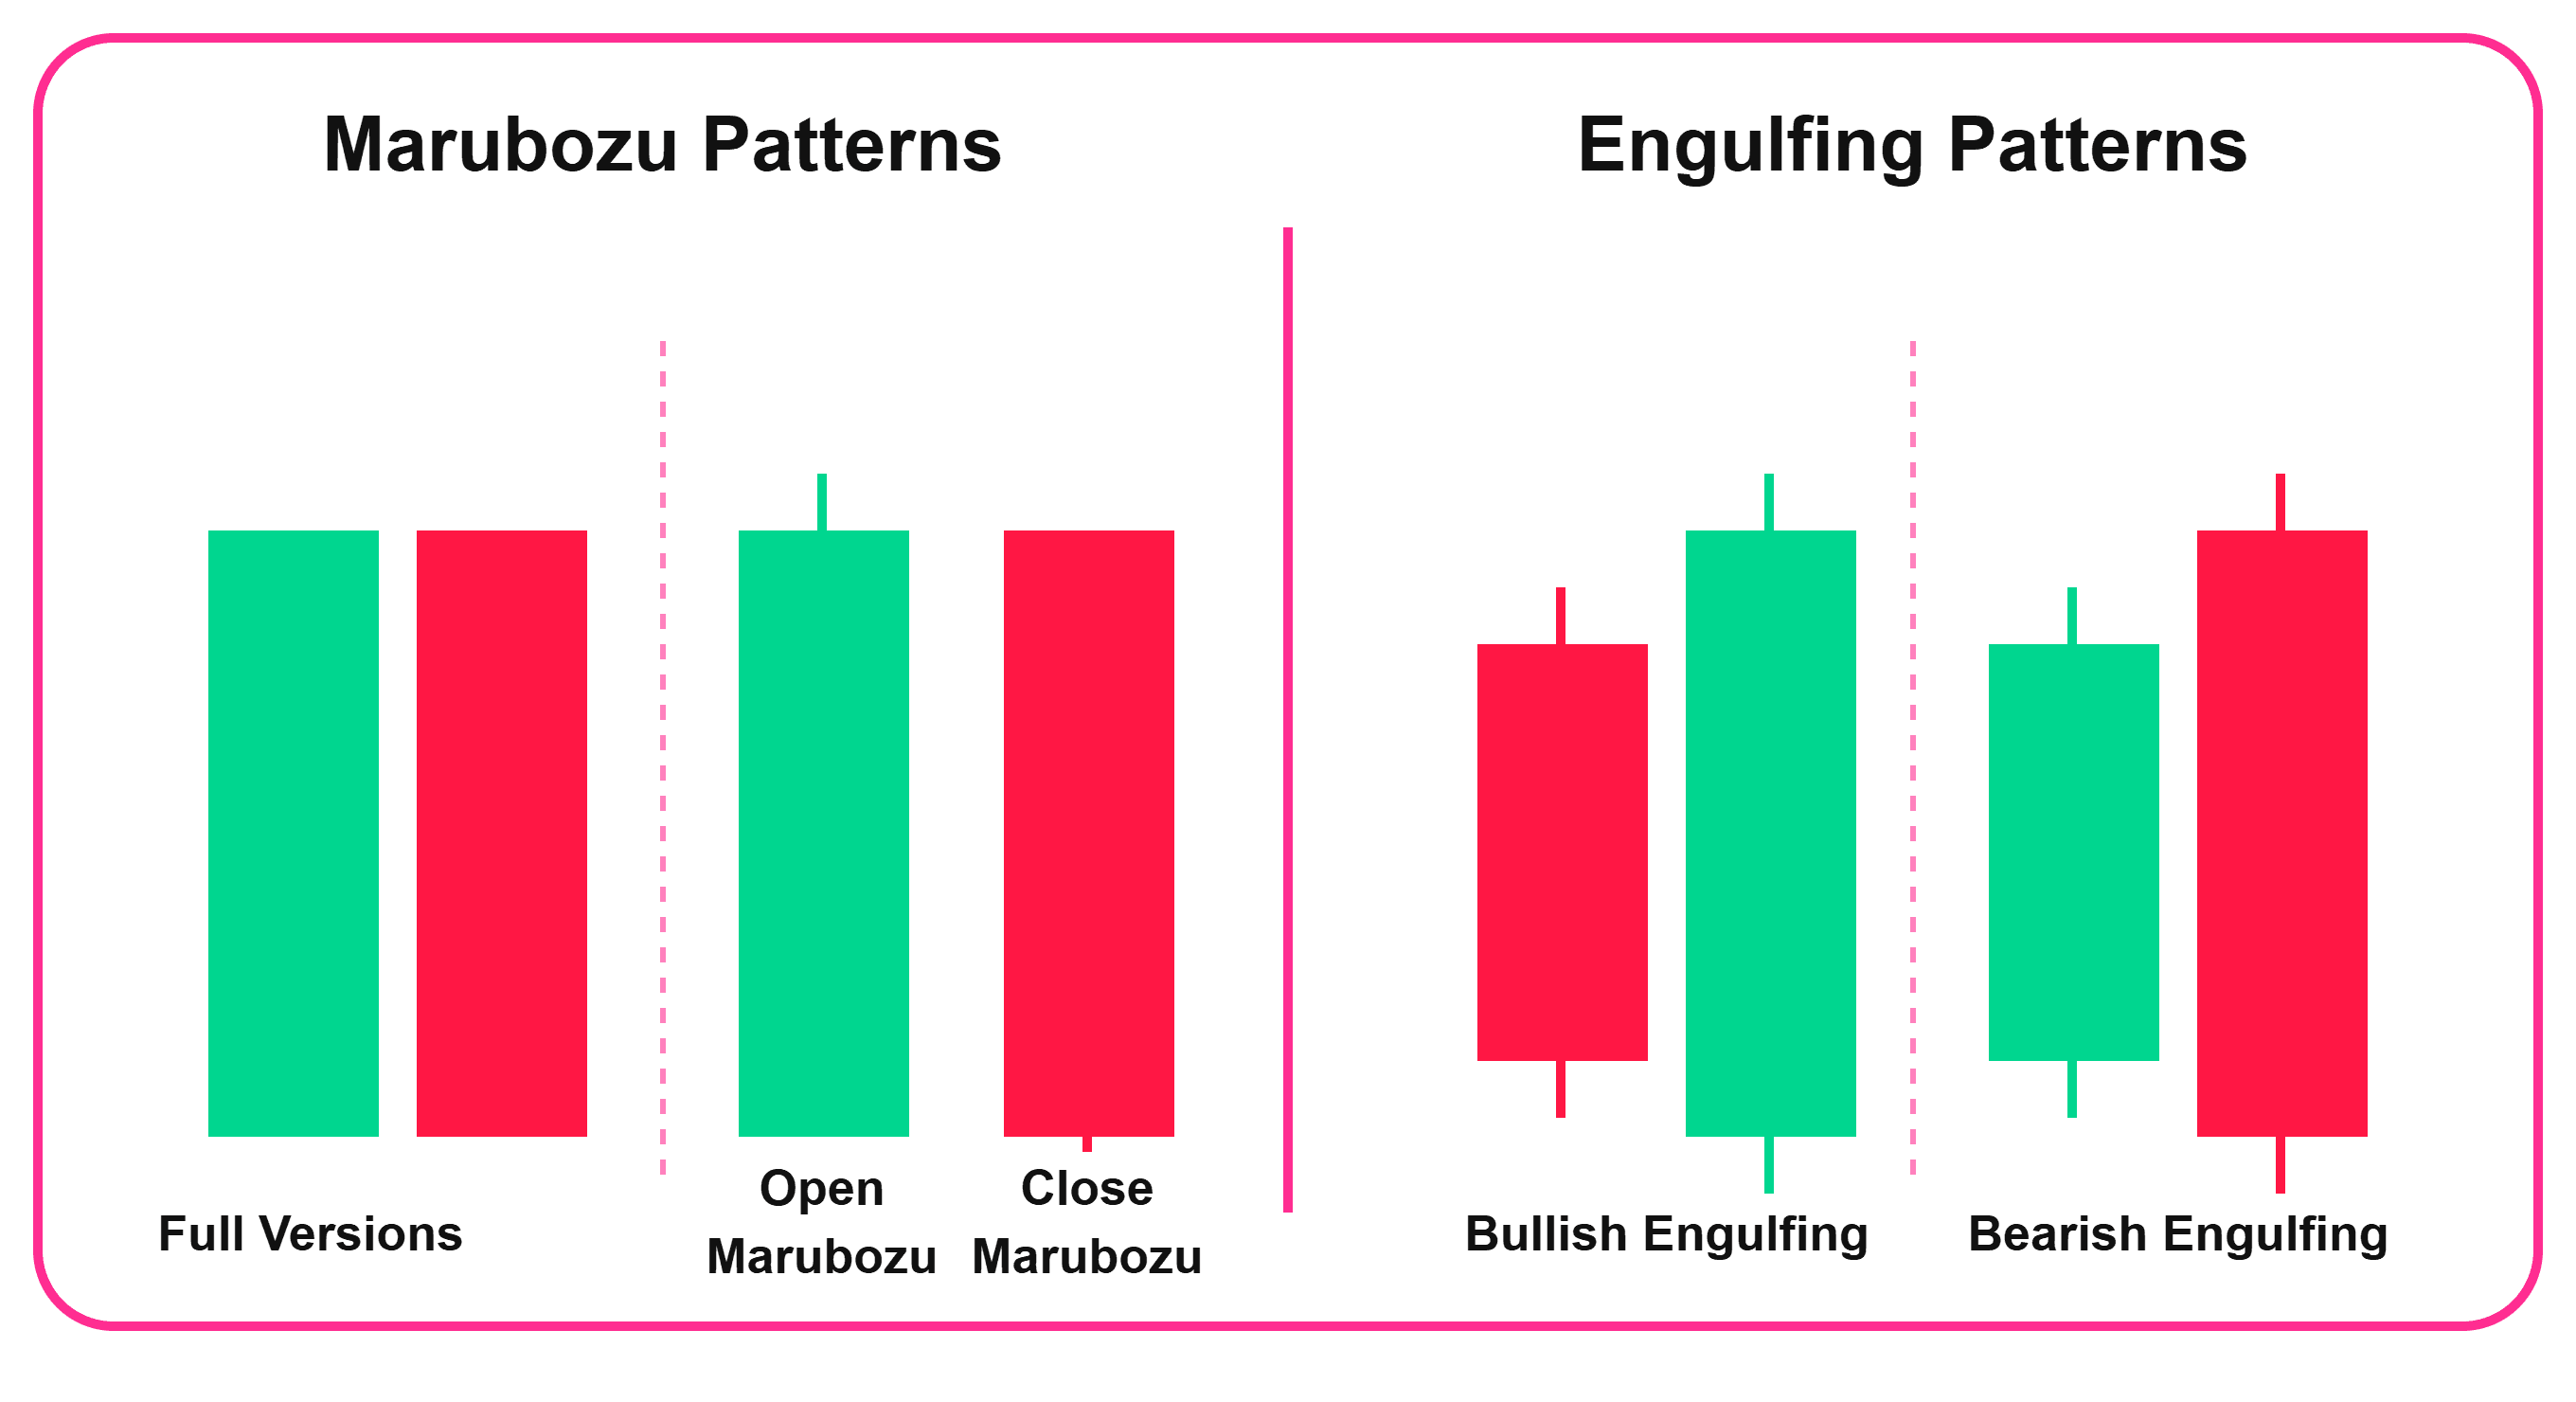
Bullish forms in a downtrend: a small red candle, then a bigger green one that swallows it whole. Bearish is the mirror image: an uptrend, a small green candle engulfed by a bigger red one.
Last engulfing top/bottom and three outside up/down
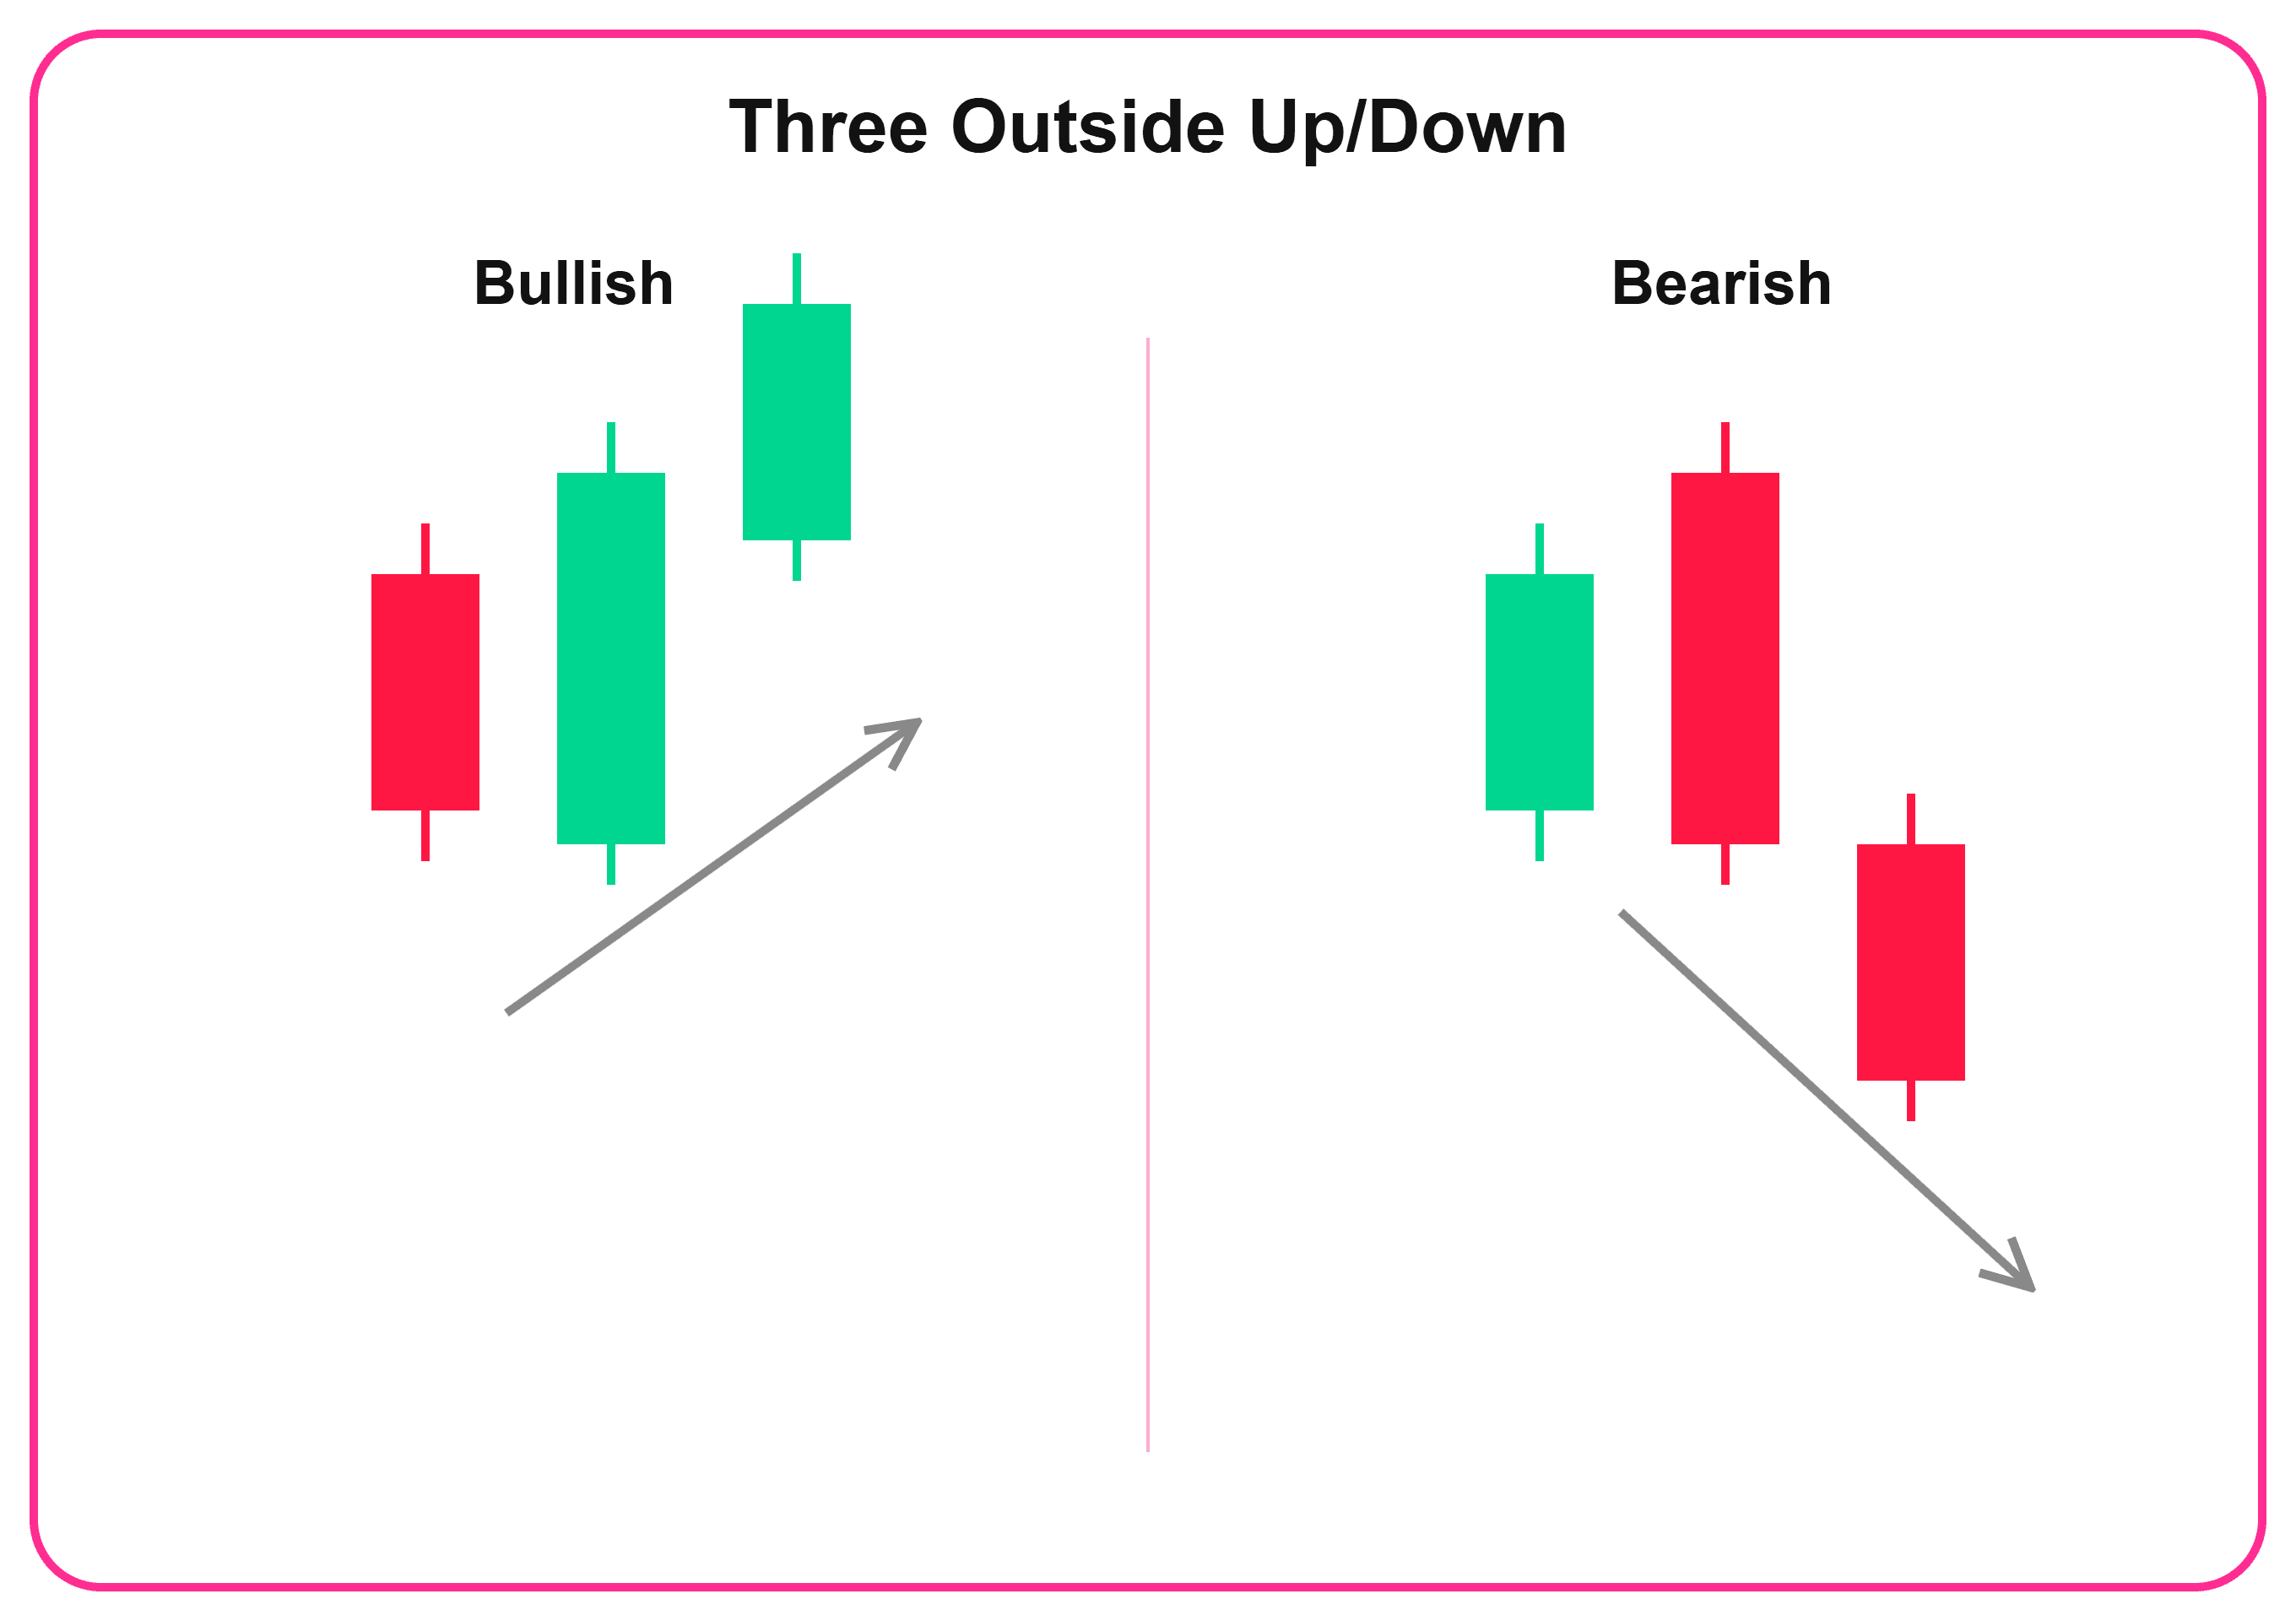
Last engulfing looks exactly like a regular engulfing pattern, but the data shows it often behaves the opposite way. It tends to continue the trend rather than reverse it. Three outside up/down is engulfing plus one extra confirming candle: safer, but a slower entry.
Two definitions
Most sources (Investopedia, Bulkowski) define engulfing using candle bodies only, ignoring the wicks. A smaller group insists the wicks need to be engulfed too: that's the stricter version. Stick with the first, more common one. It's the standard.
💡 Fintokei tip
Not sure if an engulfing pattern is valid? Check the body, not the wicks. That's the core of the definition.
How not to confuse engulfing with something else
Which markets and timeframes it works on
You can read engulfing on forex, stocks, indices, commodities and crypto. What changes is how much you can trust it.
Golden rule: engulfing on the 4H or daily chart is far less random than the same pattern on a 5-minute chart.
How to trade engulfing
1. Check the context
It needs to follow a clear trend and ideally form near a level worth watching: support, resistance, or consolidation.
2. Wait for confirmation
3. Plan your entry
4. Stop-loss and take-profit
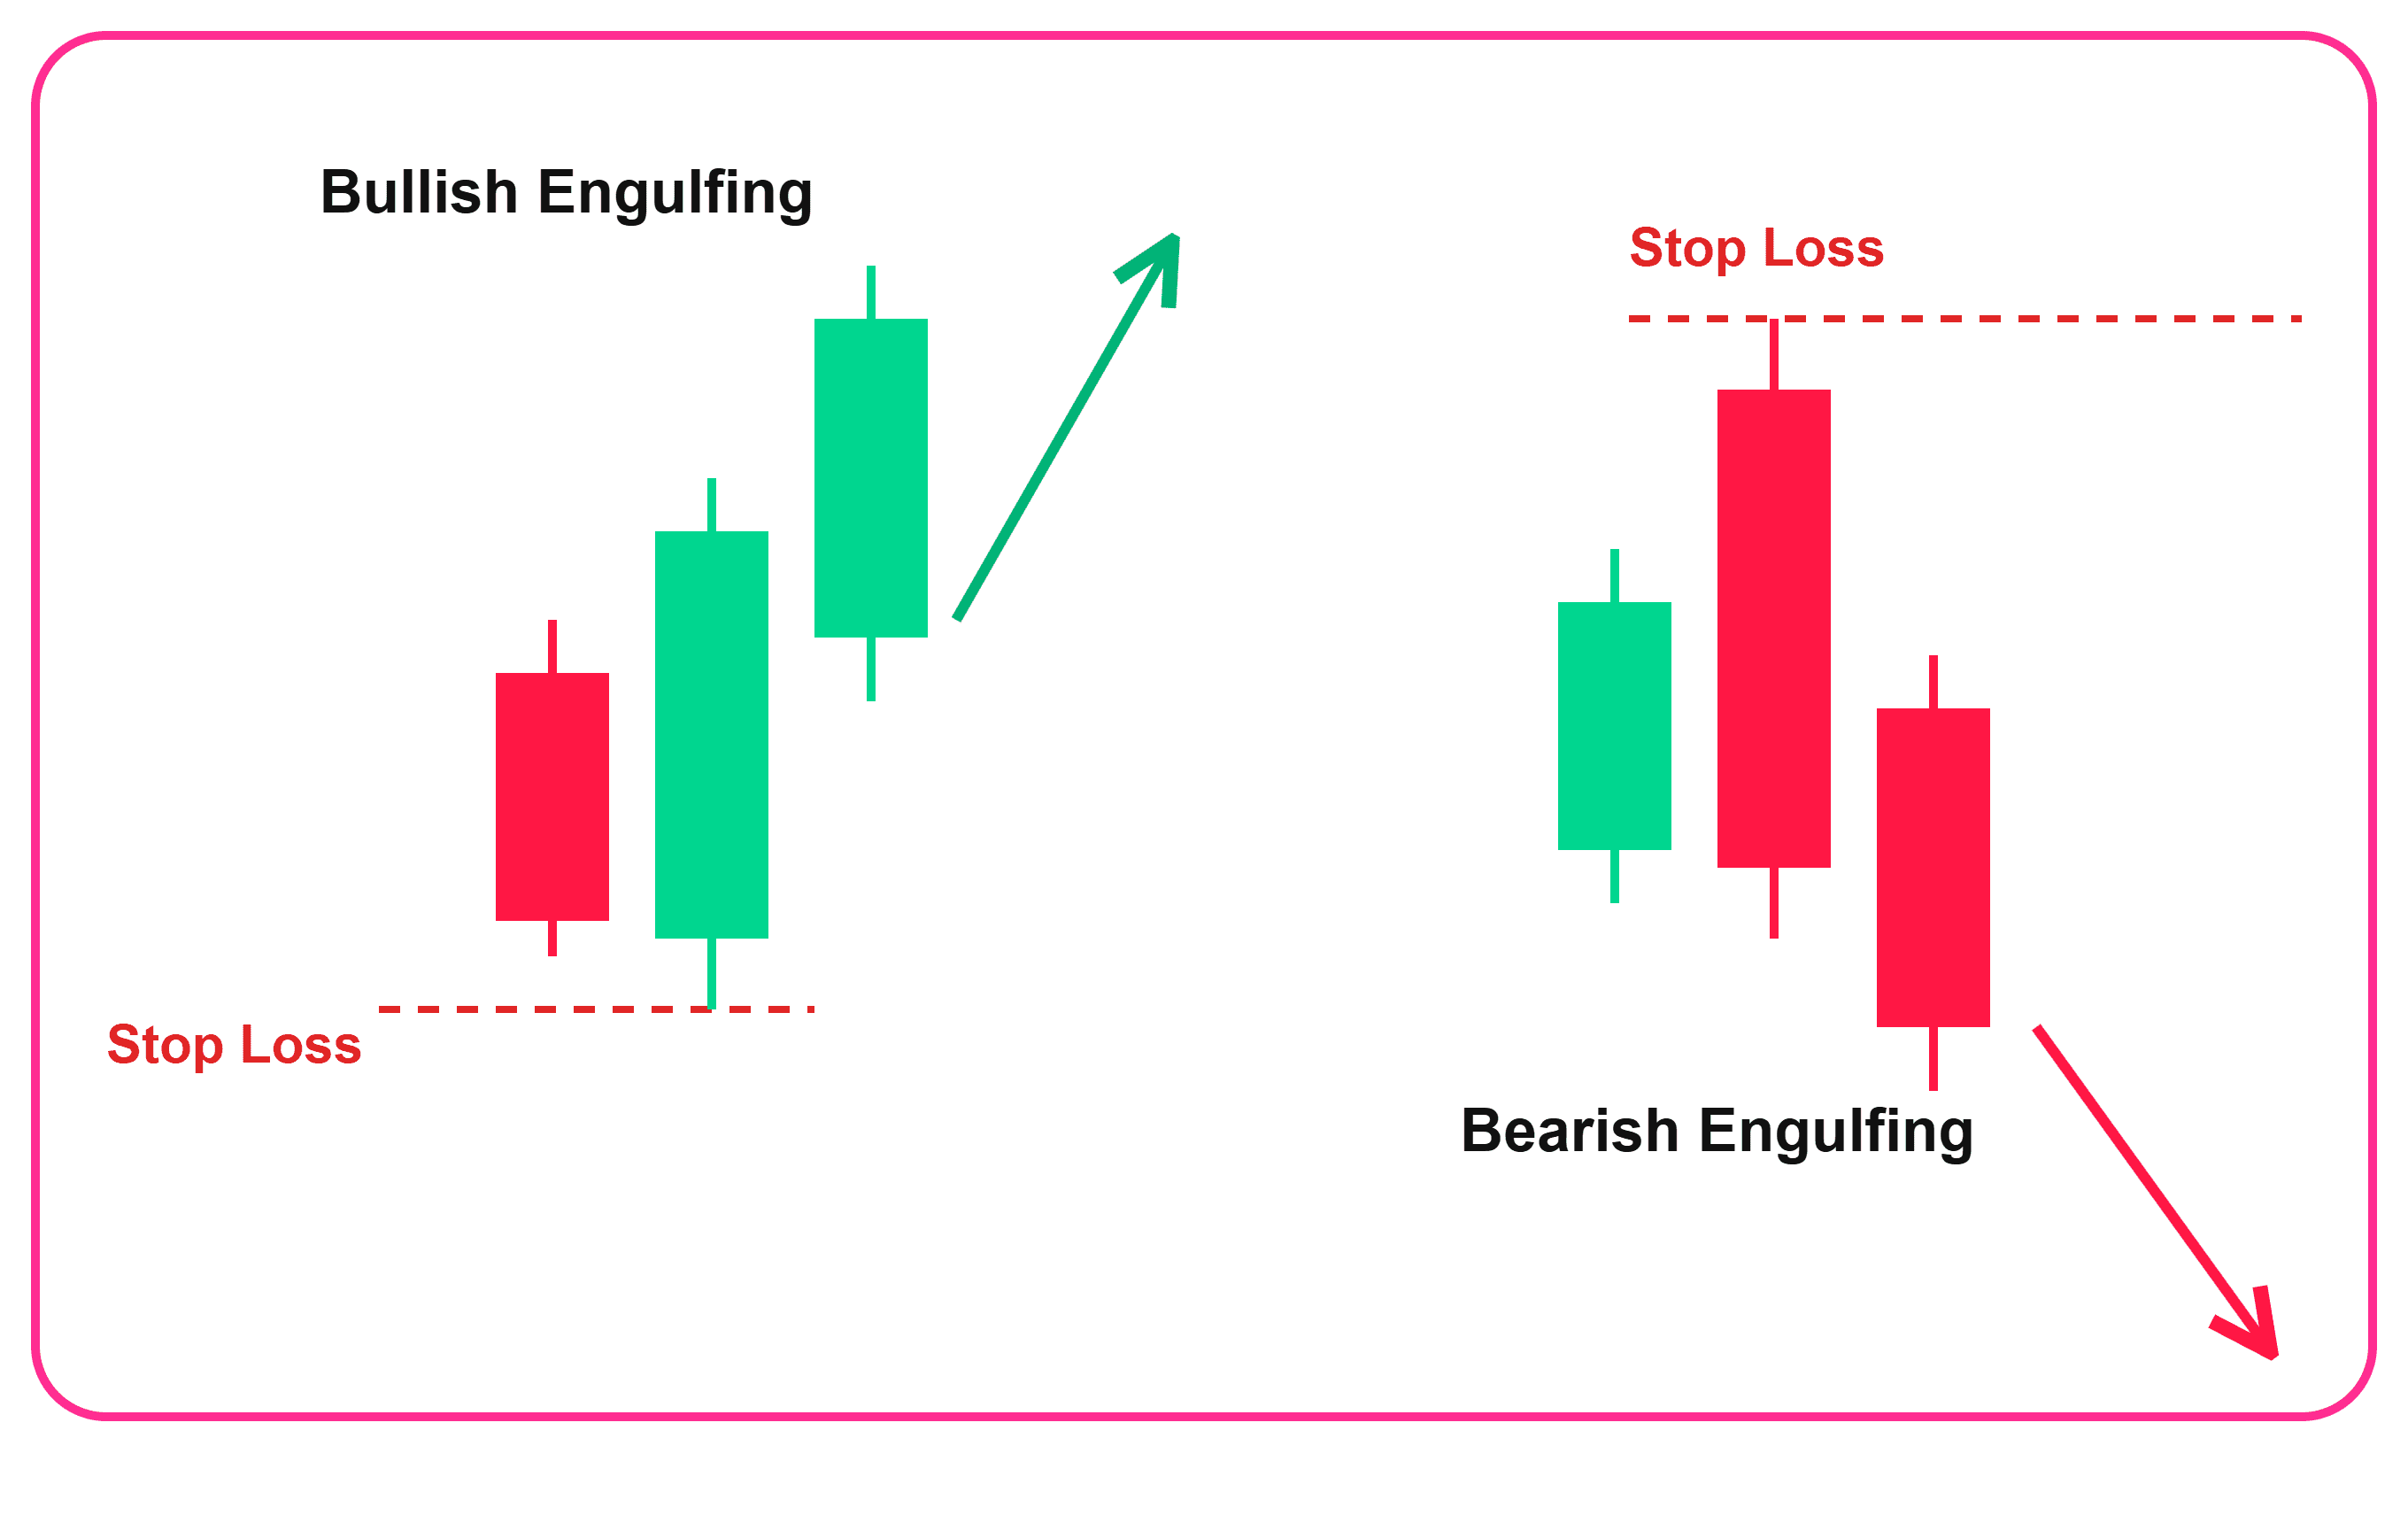
Place your stop beyond the engulfing candle's extreme: below the low for bullish, above the high for bearish. Look for your target near the nearest resistance or support, ideally with a risk/reward of at least 1:2. Anything less usually isn't worth the risk.
How not to trade engulfing
- Entering without context: in the middle of an aimless market, the pattern doesn't tell you much.
- Trading against a strong, long-term trend: it tends to be a bounce, not a reversal.
- Relying on it on very low timeframes: it forms so often there that it loses meaning.
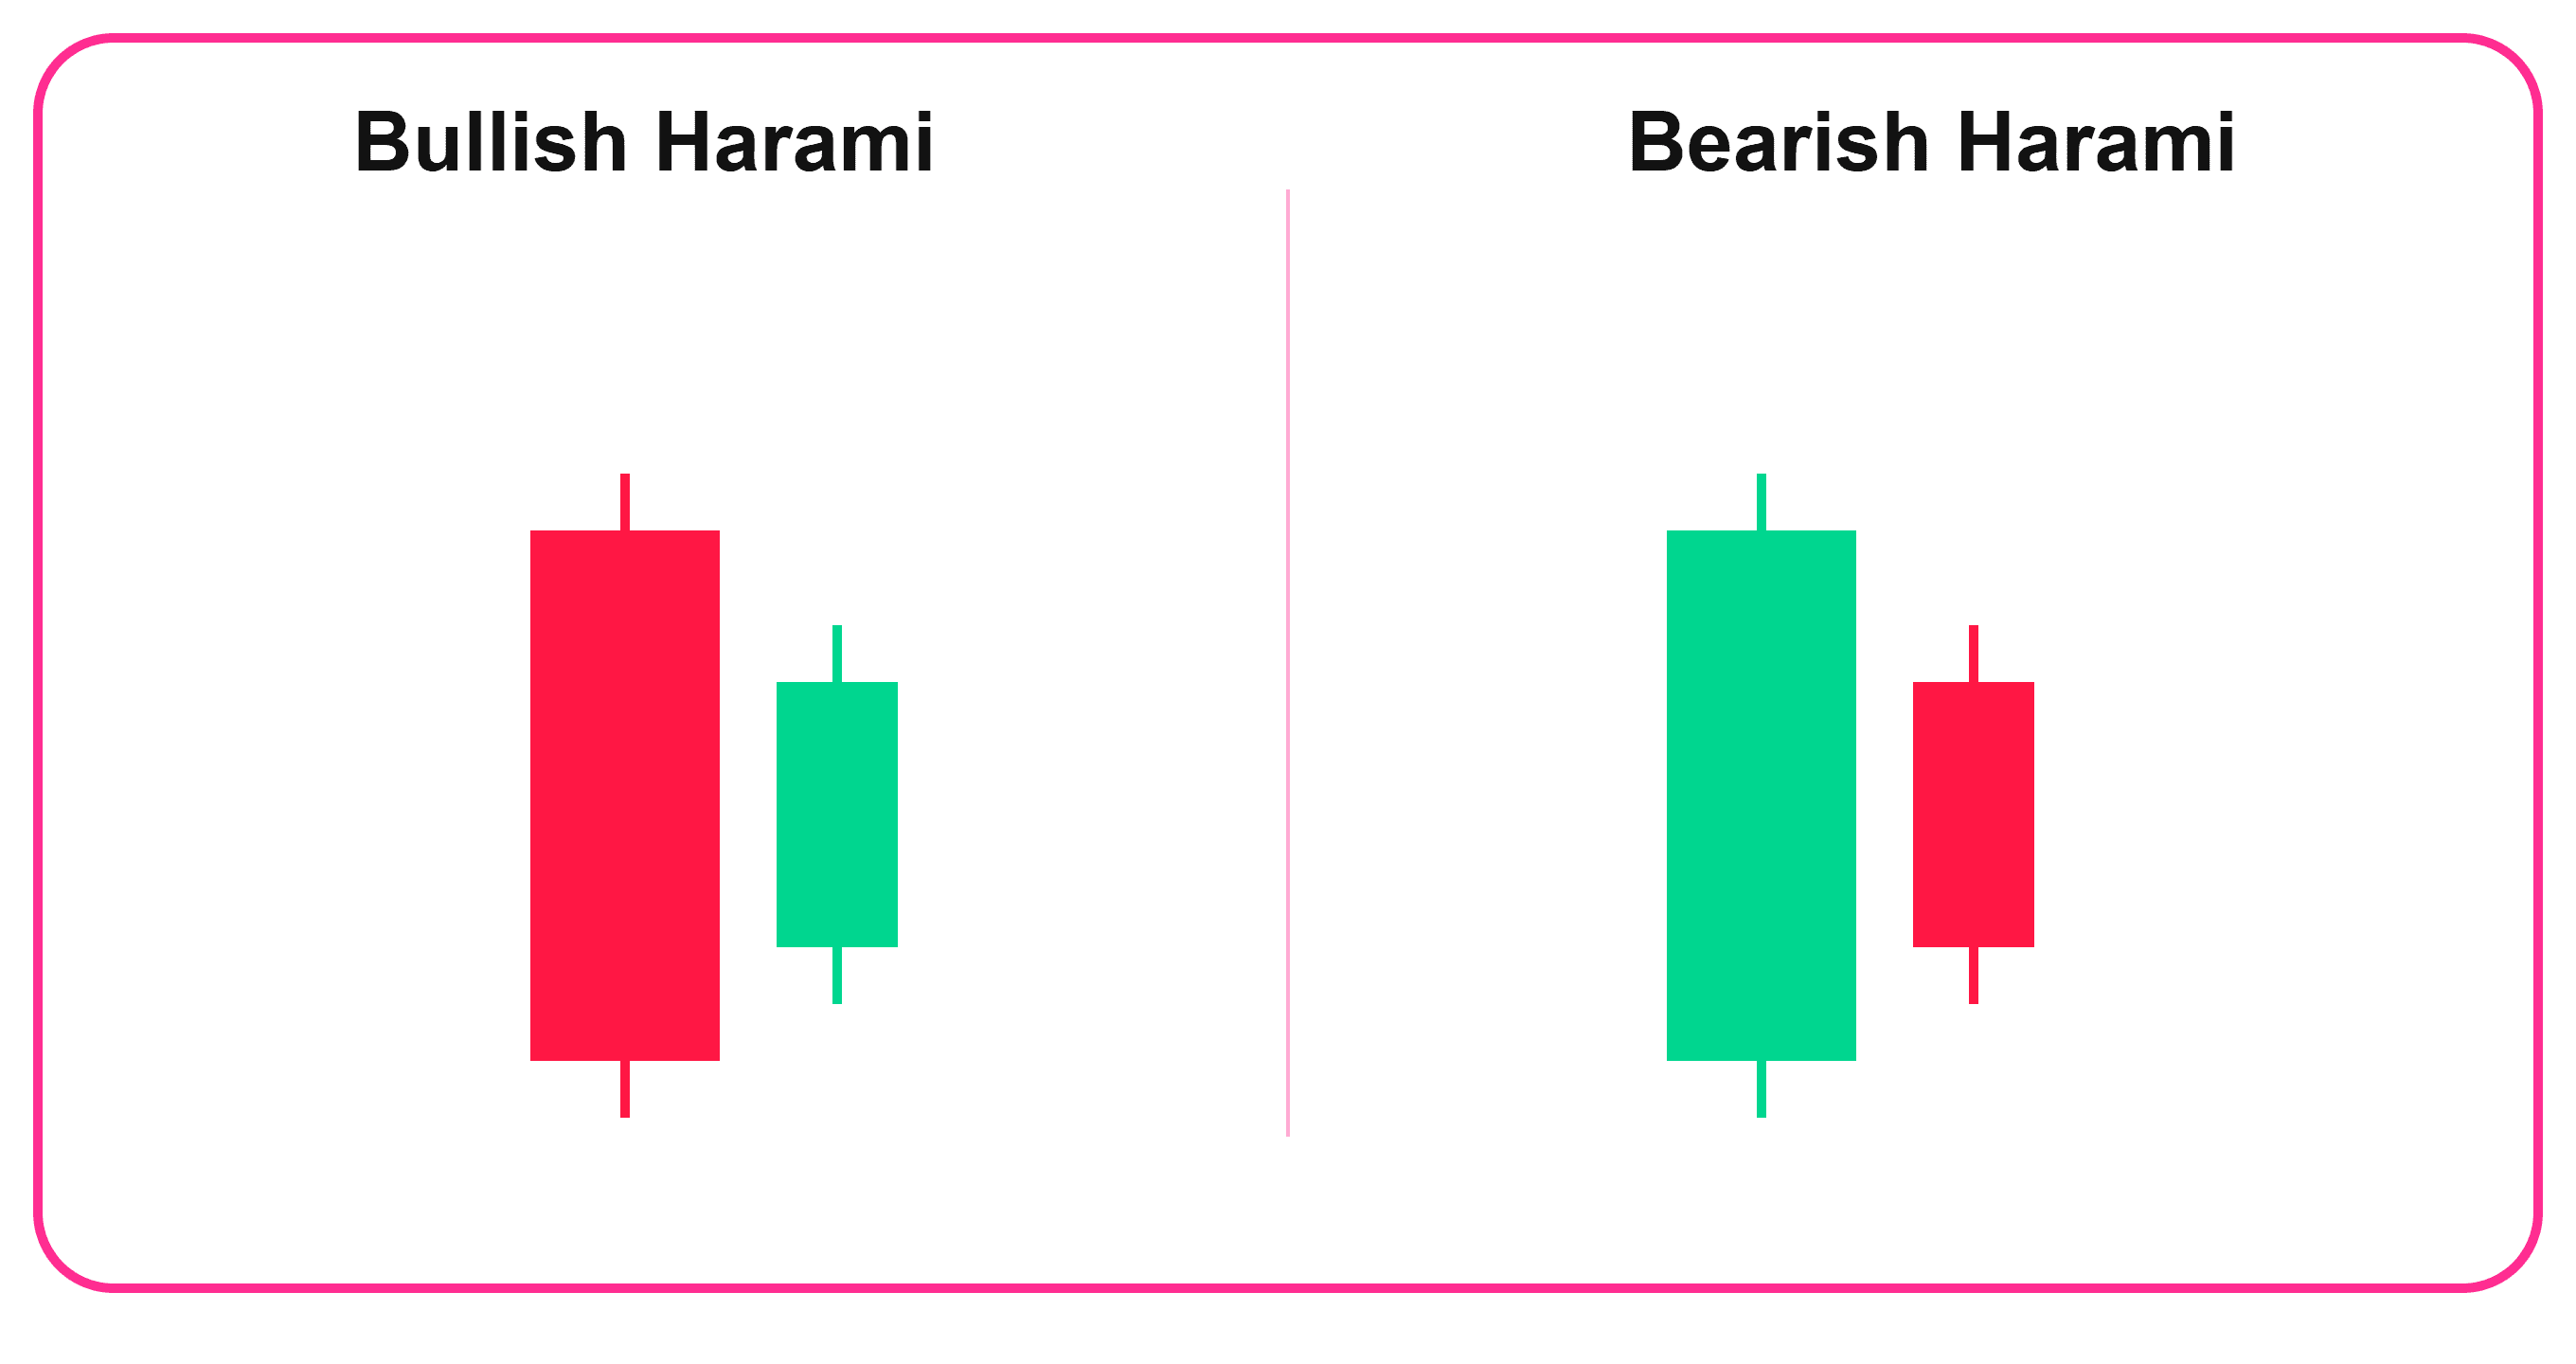
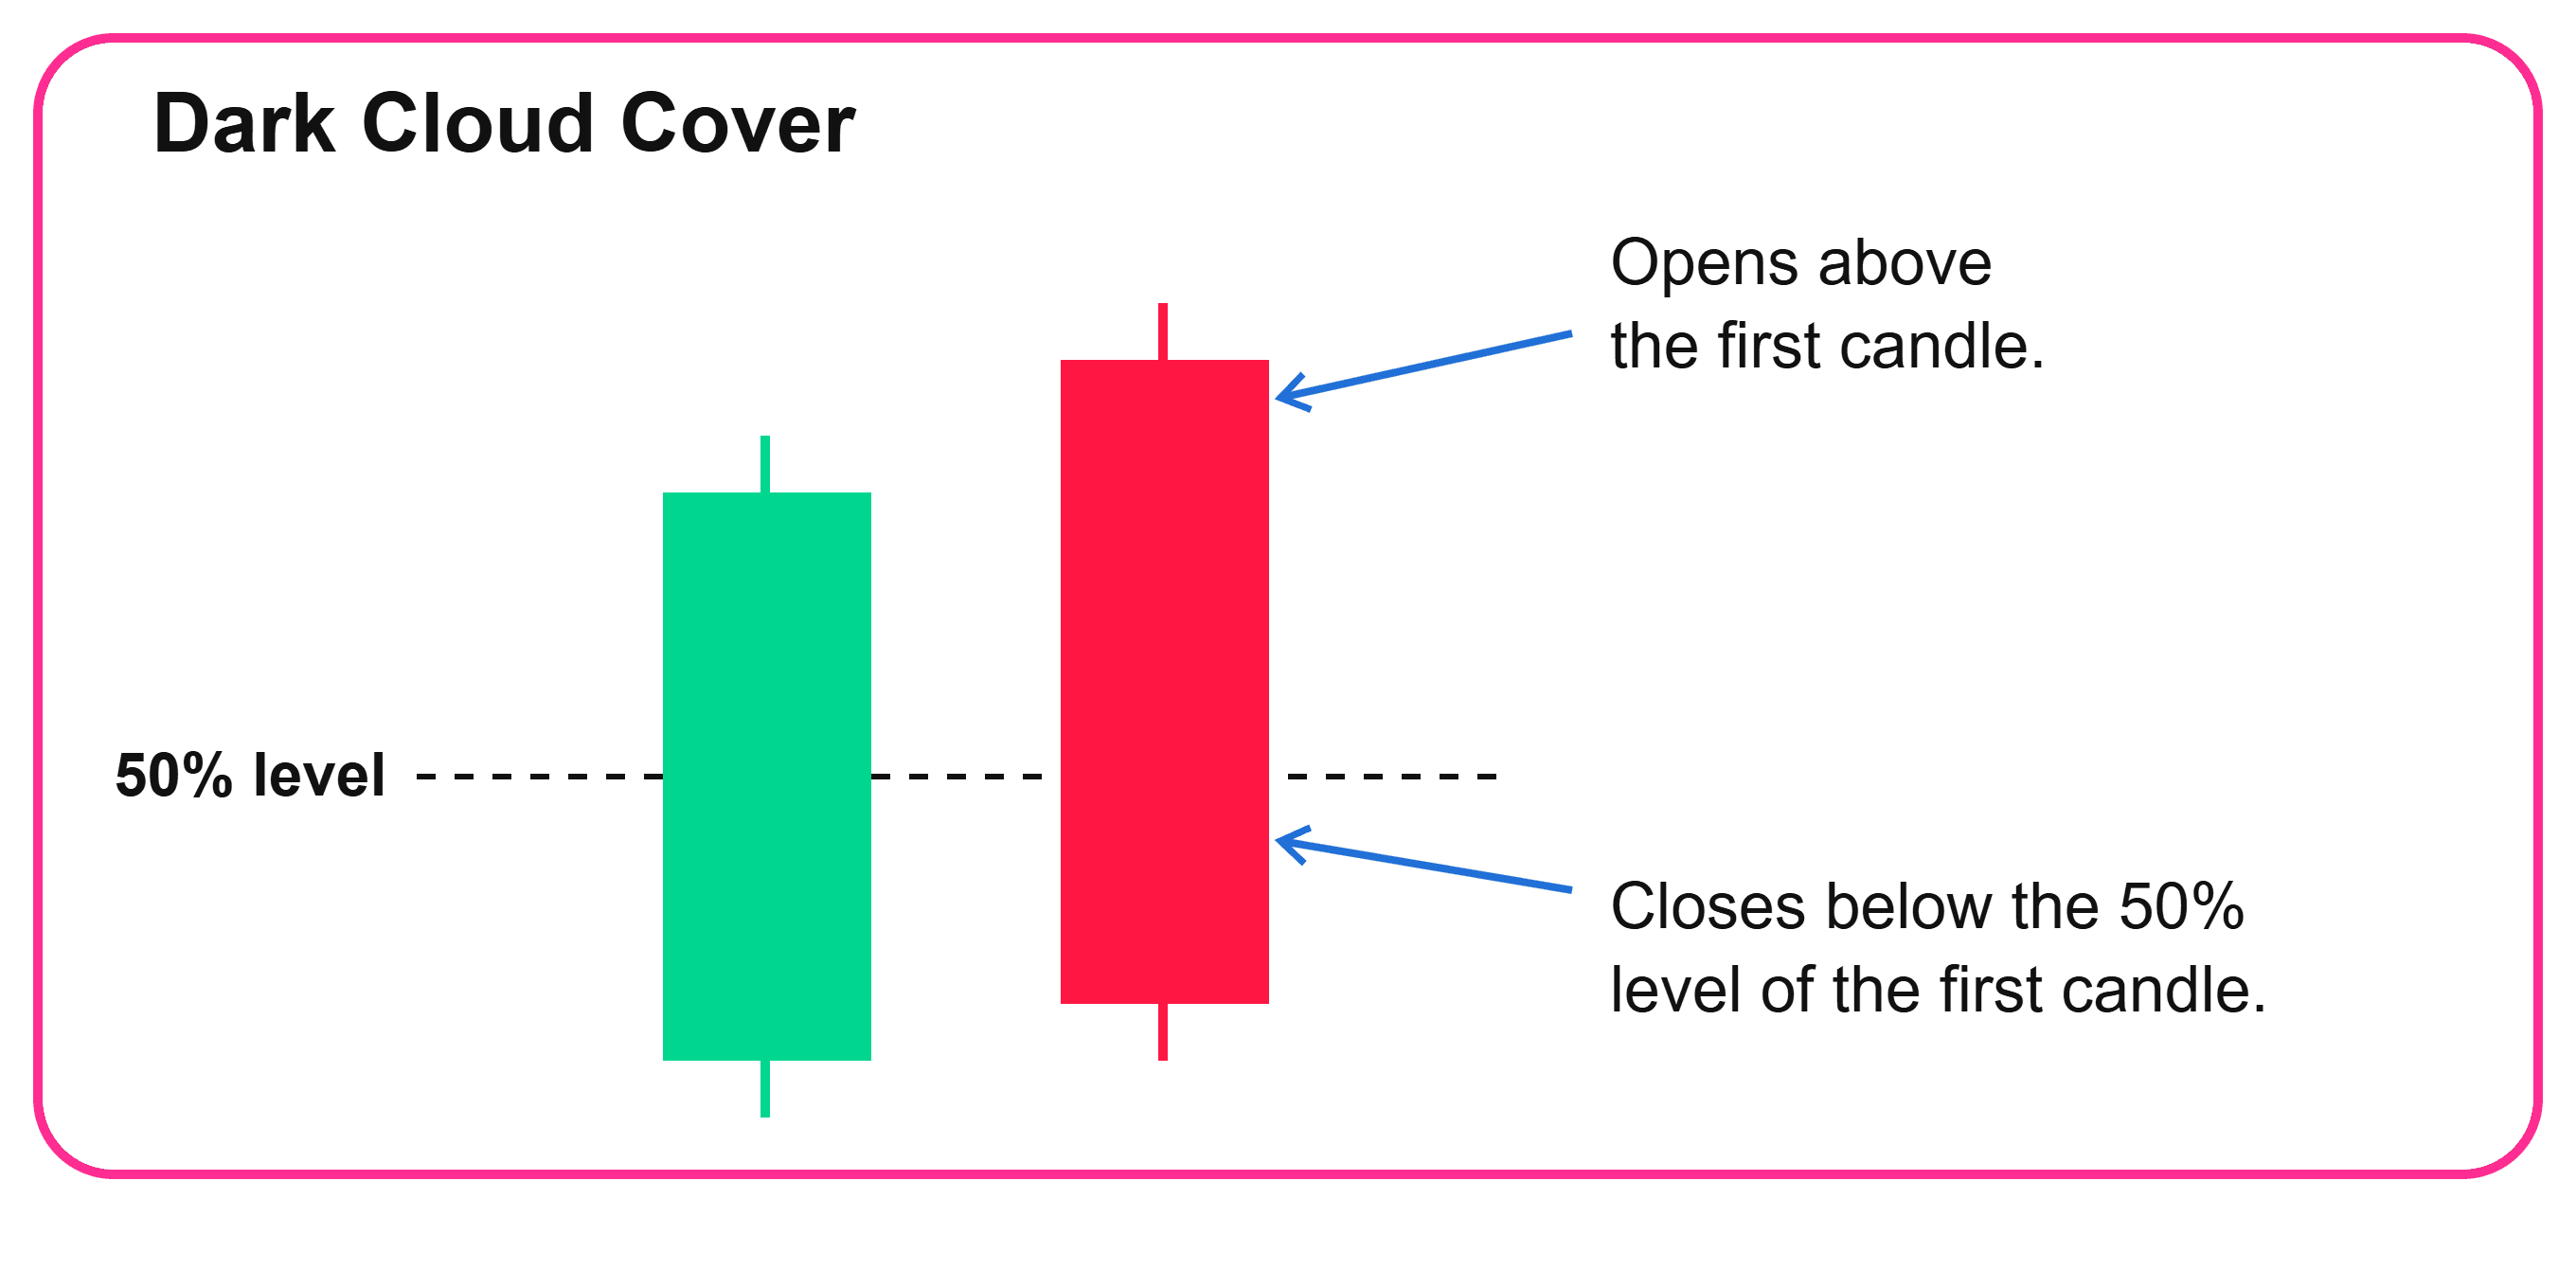
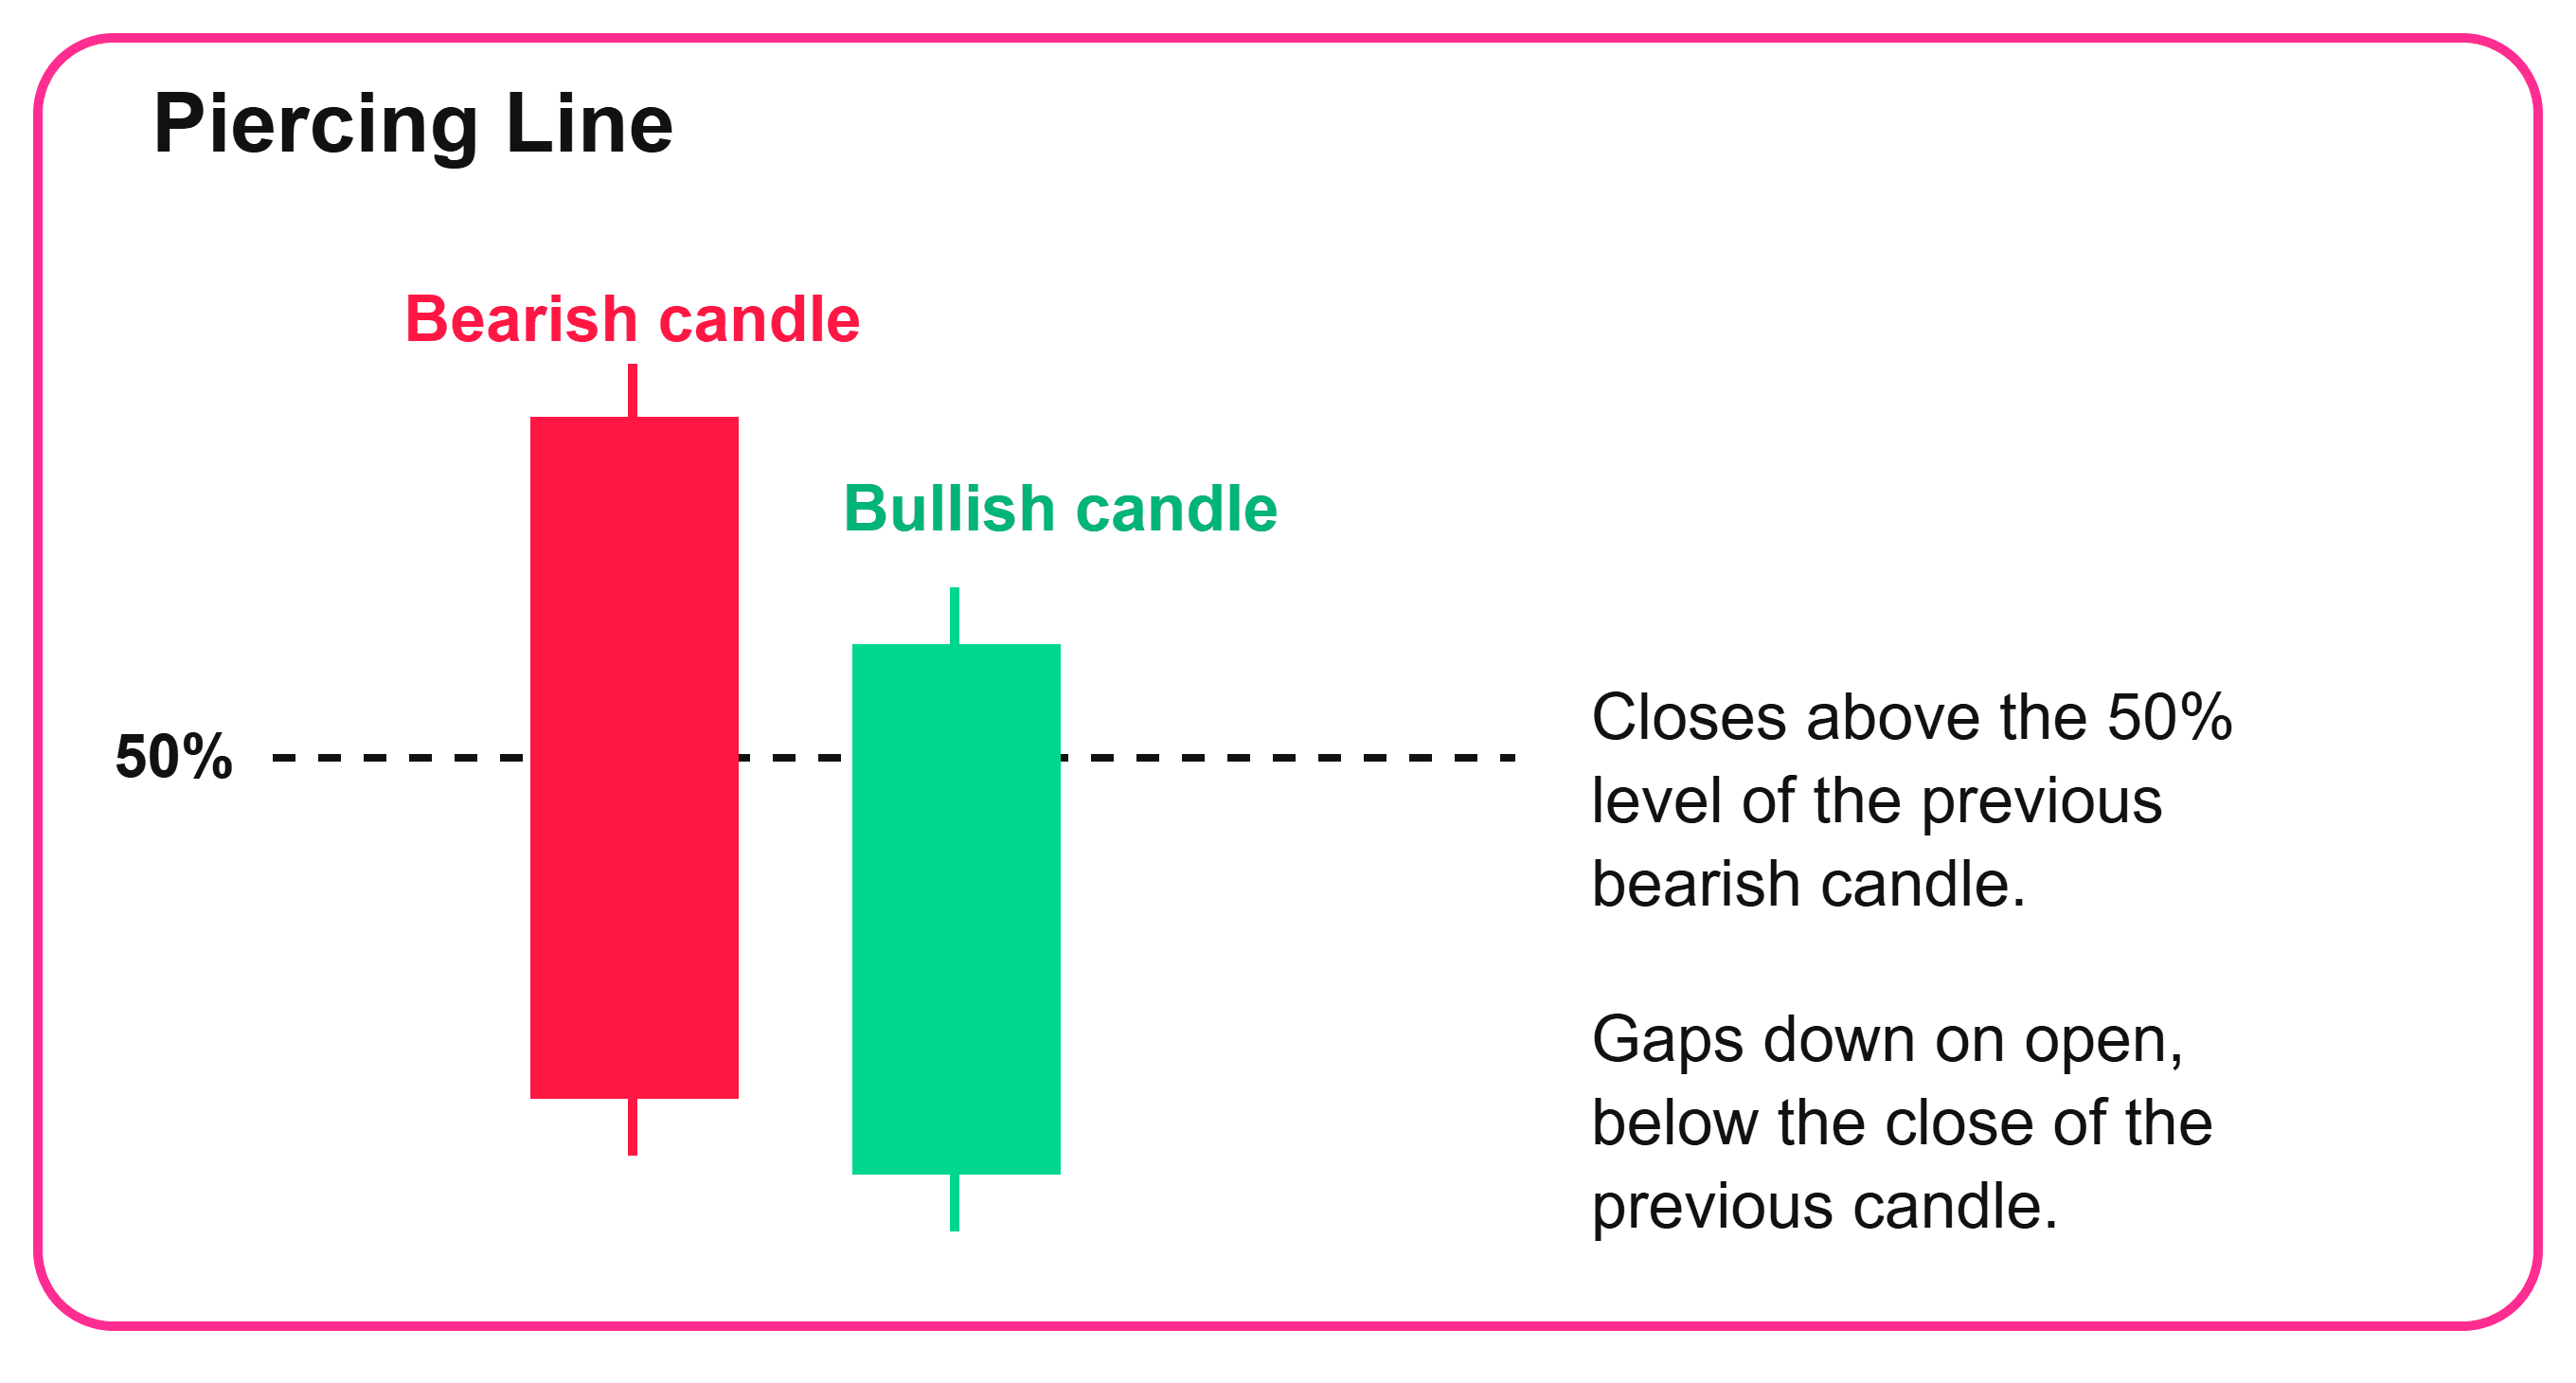
- Mixing it up with harami or piercing line: you'll overrate the strength of the signal.
- Ignoring volume: without it, you're looking at a weaker version of the story.
What to take away from the engulfing story
Engulfing shows just how quickly the balance of power in the market can break. One candle wipes out the previous one's work and forces traders on the wrong side to react. That forced reaction, not the candle's size, is what gives the pattern its strength.
The pattern tells you control has shifted. It doesn't tell you the trend will definitely turn. Context, volume, and confirmation decide that. Spotting the pattern isn't the point; understanding why it formed is.