Swing trading chart patterns that work (and how to read them)
Not every shape on your chart deserves your attention. 👀 On the Fintokei blog, we'll show you which swing trading chart patterns actually hold up, and how to read them without the rookie mistakes.
What are chart patterns?
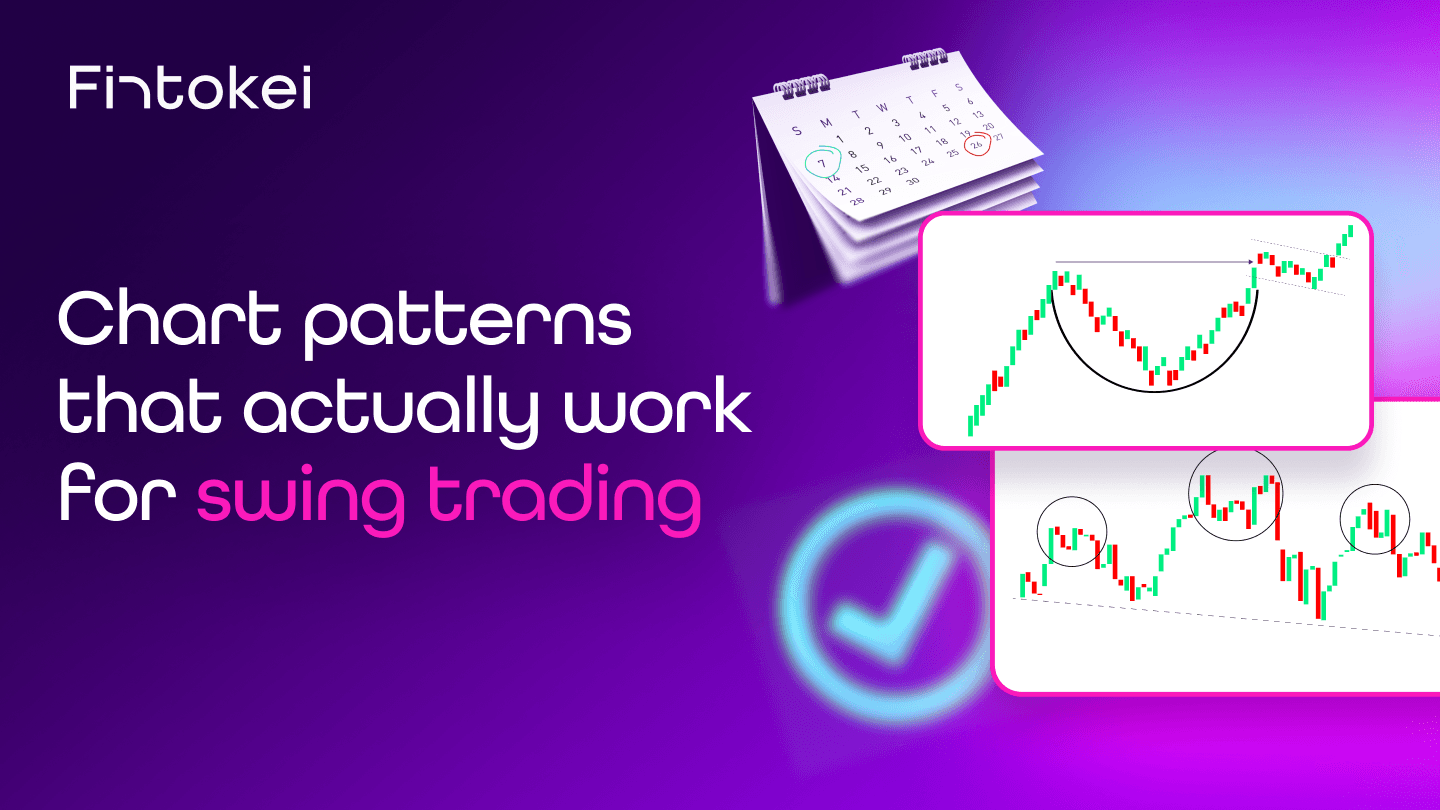
Chart patterns are recurring shapes that price draws on a chart. They hint at where the market is likely to go next. There are two main groups: reversal patterns (like head and shoulders) signal a trend change, and continuation patterns (flags, triangles) signal the trend is about to keep going after a short pause.
They're not the same as candlestick patterns! Those form from one or two candles and catch a short-term shift in sentiment. Chart patterns build up over dozens of candles and show you the market's bigger structure. Both work great together, and we'll get to that.
💡 Fintokei tip
We covered trend reversals in detail in How to spot a trend reversal — it also breaks down how to tell a real pattern from a random pullback.
What is swing trading?
Swing trading means holding a position for anywhere from a few days to a few weeks to capture one full price move, a "swing." No glueing yourself to the chart all day! Your main analysis happens on the daily or 4H chart, and you time your entry on a lower timeframe.
Because swing traders hold positions overnight and over weekends, the account behind you matters. Plenty of challenges hit you with a negative swap for holding a position overnight, quietly chipping away at your open trade even when the market isn't moving. Easy to miss, but it adds up fast on a multi-week swing strategy. How do we handle this at Fintokei? Check out our ProTrader Swing challenge.
How are chart patterns different for swing trading vs. scalping and day trading?
In swing trading, you're reading patterns on the daily or 4H chart. Less noise, more weight — these patterns capture days or weeks of market behavior, not a few minutes. The same pattern on a 5-minute or 15-minute chart for scalping or day trading forms faster, but it's a lot easier to get burned by a fake breakout.
Volume as your confirmation signal
A pattern without volume is just a nice shape on a chart. A breakout above resistance or below support backed by higher volume is far more likely to hold. A pattern that completes on weak volume? Treat that as a warning, not a green light.
💡 Fintokei tip
To check order volume, add the Volume indicator to your chart. In TradingView, click Indicators in the top bar and search for Volume.
Confirmation across multiple timeframes
Always check a daily-chart pattern against the weekly too. Same direction on both? That's a stronger signal. This is exactly what swing trading gives you room for: time to wait for confirmation without missing the whole move.
What to watch out for
- Jumping into a pattern before it's actually confirmed (no breakout yet).
- Ignoring the dominant trend on a higher timeframe.
- Overrating a pattern with no volume behind it.
Which chart patterns work best for swing trading?
The best chart patterns for swing trading are the ones that build over days to weeks on the daily or 4H chart. Long enough to carry weight, quick enough that you'll actually see them play out. Here's a breakdown of the most useful ones.
💡 Fintokei tip
Chart patterns work best paired with candlestick patterns at a key level — an engulfing candle at the neckline of a head and shoulders is a stronger signal than the pattern alone. Check out our articles on the hammer and doji patterns too.
How not to trade chart patterns in swing trading
A chart pattern on its own isn't a trade signal. It's a hint that still needs confirmation. Here's what turns a useful tool into a trap:
- Trading without volume confirmation — you jump in the moment price "looks" like it broke out, instead of waiting for a confirming candle with volume behind it.
- Ignoring the dominant trend — you trade a reversal pattern against a strong higher-timeframe trend. The other side is simply stronger.
- Chasing an unfinished pattern — you enter before the pattern has actually completed, just so it doesn't "get away."
- Skipping the stop-loss — this one's a classic. The pattern gives you a natural spot for your stop, so why not use it?
And these rules apply whether you're trading a free trial or a paid Fintokei challenge.
Curious what's inside?
Create a free account and explore the Fintokei zone — loyalty rewards, dashboards, refer a friend and more. No challenge required.
How to start trading chart patterns in swing trading
Chart patterns need room and time to play out, and a typical trading challenge won't give you that. Most are built for intraday traders and scalpers. That's exactly why we built the Fintokei ProTrader Swing challenge: no risk of getting knocked out of a position just for holding it overnight or over the weekend.
Fintokei ProTrader Swing — built for swing trading
Want to see how chart patterns hold up in real swing trading?
Start your ProTrader Swing challenge today! Use code NEW20 for 20% off your first challenge.
Frequently asked questions
Are chart patterns useful for passing a Fintokei challenge?
Yes. Chart patterns are one of the core technical analysis tools you can use while trading a Fintokei challenge. They work best combined with other tools, like solid risk management or volume confirmation, rather than as a standalone signal.
Are chart patterns more reliable than candlestick patterns?
Neither category is universally more reliable, they just answer different questions. Chart patterns show you the market's broader structure over days to weeks, while candlestick patterns catch an immediate shift in sentiment. You get the strongest signal when both line up at the same level.
How many timeframes should I watch for swing trading?
Two or three is plenty: a higher timeframe (weekly or daily) for overall context and trend, the daily or 4H for the pattern itself, and the 1H for more precise entry timing.
Do chart patterns work on crypto or indices?
Yes, the same principles apply to any liquid market — forex, stock indices, and crypto included. With crypto, expect higher volatility: patterns form faster and can throw off more false signals.
How long does it take for a chart pattern to confirm?
It depends on the pattern and the timeframe. A flag on the daily chart typically forms in one to four weeks, while a head and shoulders or cup and handle can take months. As a rule of thumb, the higher the timeframe, the longer the pattern takes and the more weight it carries.
Is a chart pattern enough on its own to make a trading decision?
No. A pattern is a clue, not a signal to enter immediately. Always confirm it with volume, the direction of the dominant trend, and ideally a higher timeframe before you open a position.

My job is to make sure everything works exactly as it should for our traders. After testing ProTrader Swing, I switch to real swings with kettlebells at the gym, or dive into digital illustration and video games to recharge. Favorite platform: cTrader. Favorite challenge: ProTrader Swing.