How to spot a trend reversal?
A trend reversal doesn't come with a sign saying “here it is.” You can spot it through a mix of fading momentum, a break of a key support or resistance level, and confirming candlestick patterns like Doji or Engulfing. But one signal is never enough. Always check it on a higher timeframe, or you'll easily mistake a reversal for a regular pullback. And that's a mistake you don't want to make.
What is a market trend?
A trend is simply the direction price moves over time: up, down, or sideways. An uptrend shows a series of higher highs and higher lows, a downtrend the opposite – lower highs and lower lows. A sideways market just bounces around within a range with no clear direction. Want to pass a Fintokei challenge? Spotting a shift in trend is one of the first steps!
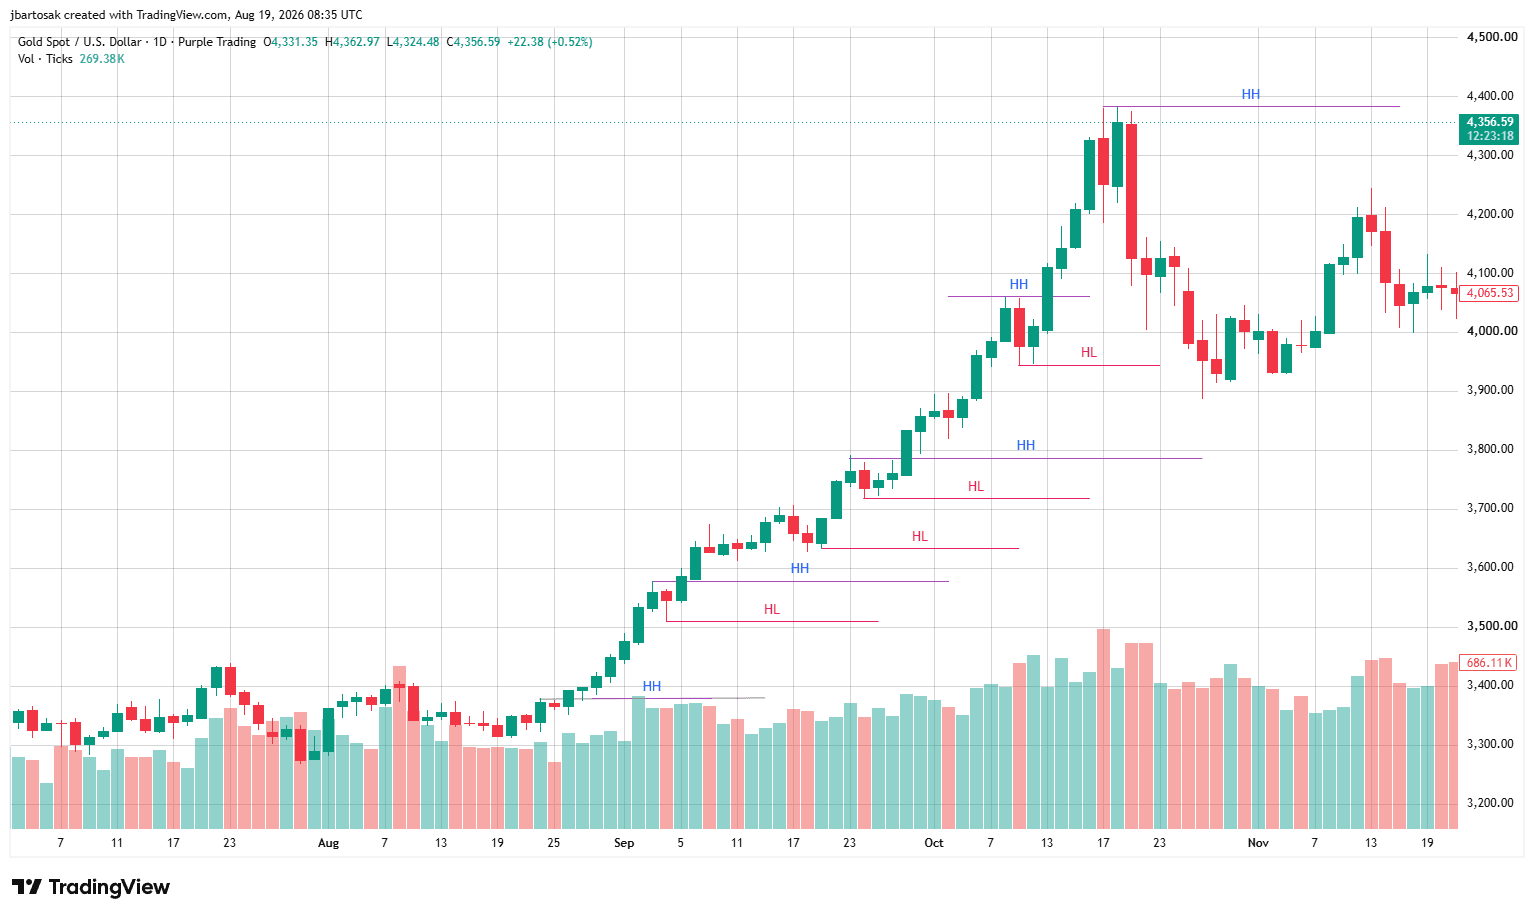
An uptrend on gold, running uninterrupted from early September through the end of October 2025 (D1 timeframe).
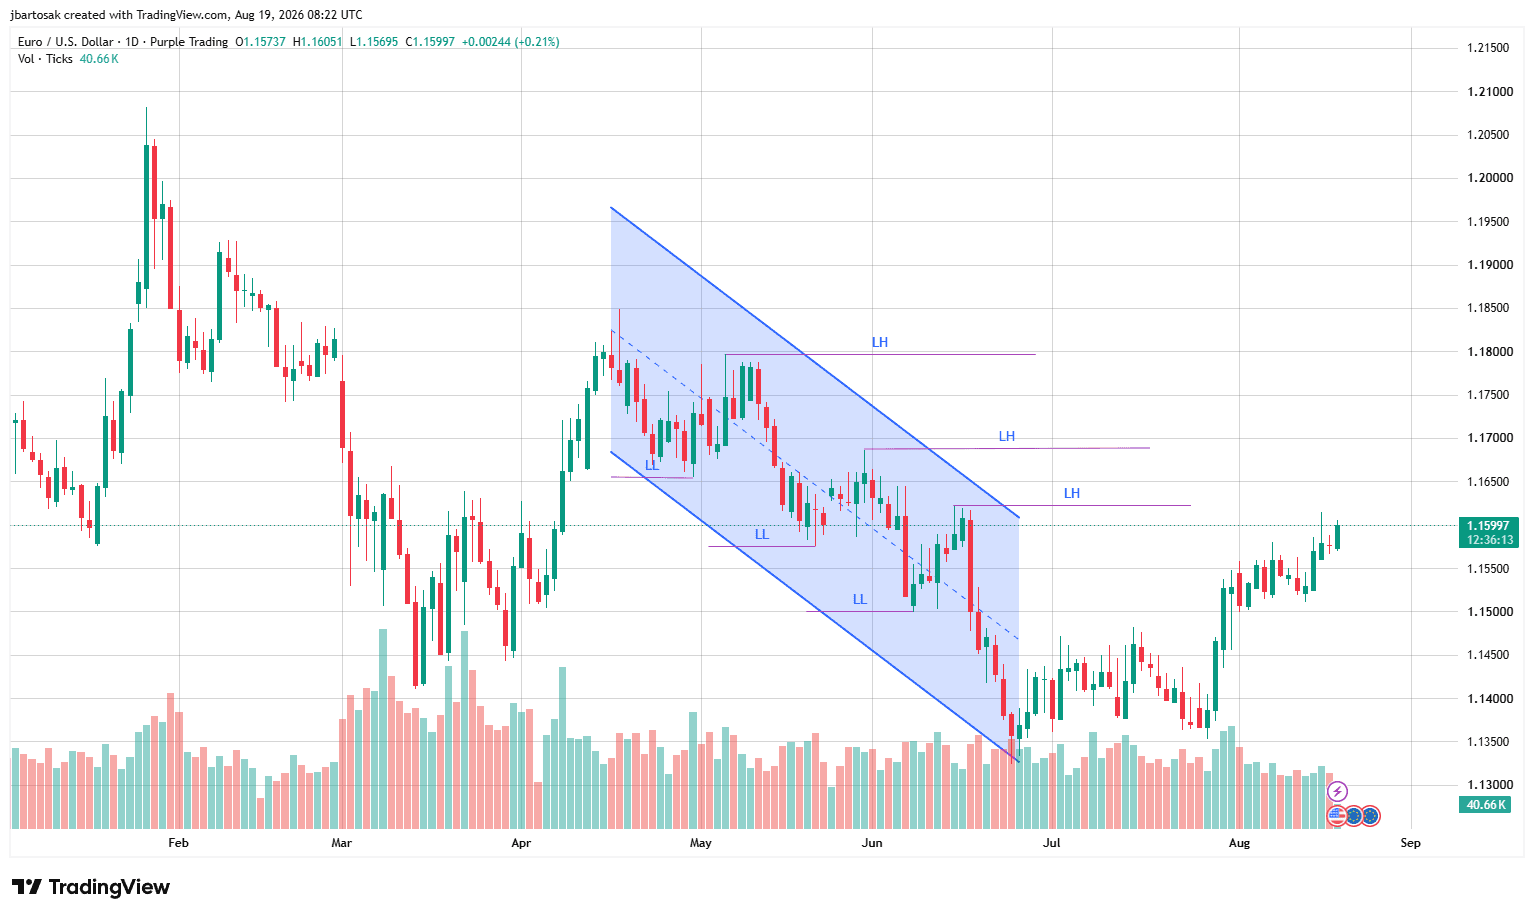
An example of a downtrend on EUR/USD (D1 timeframe).
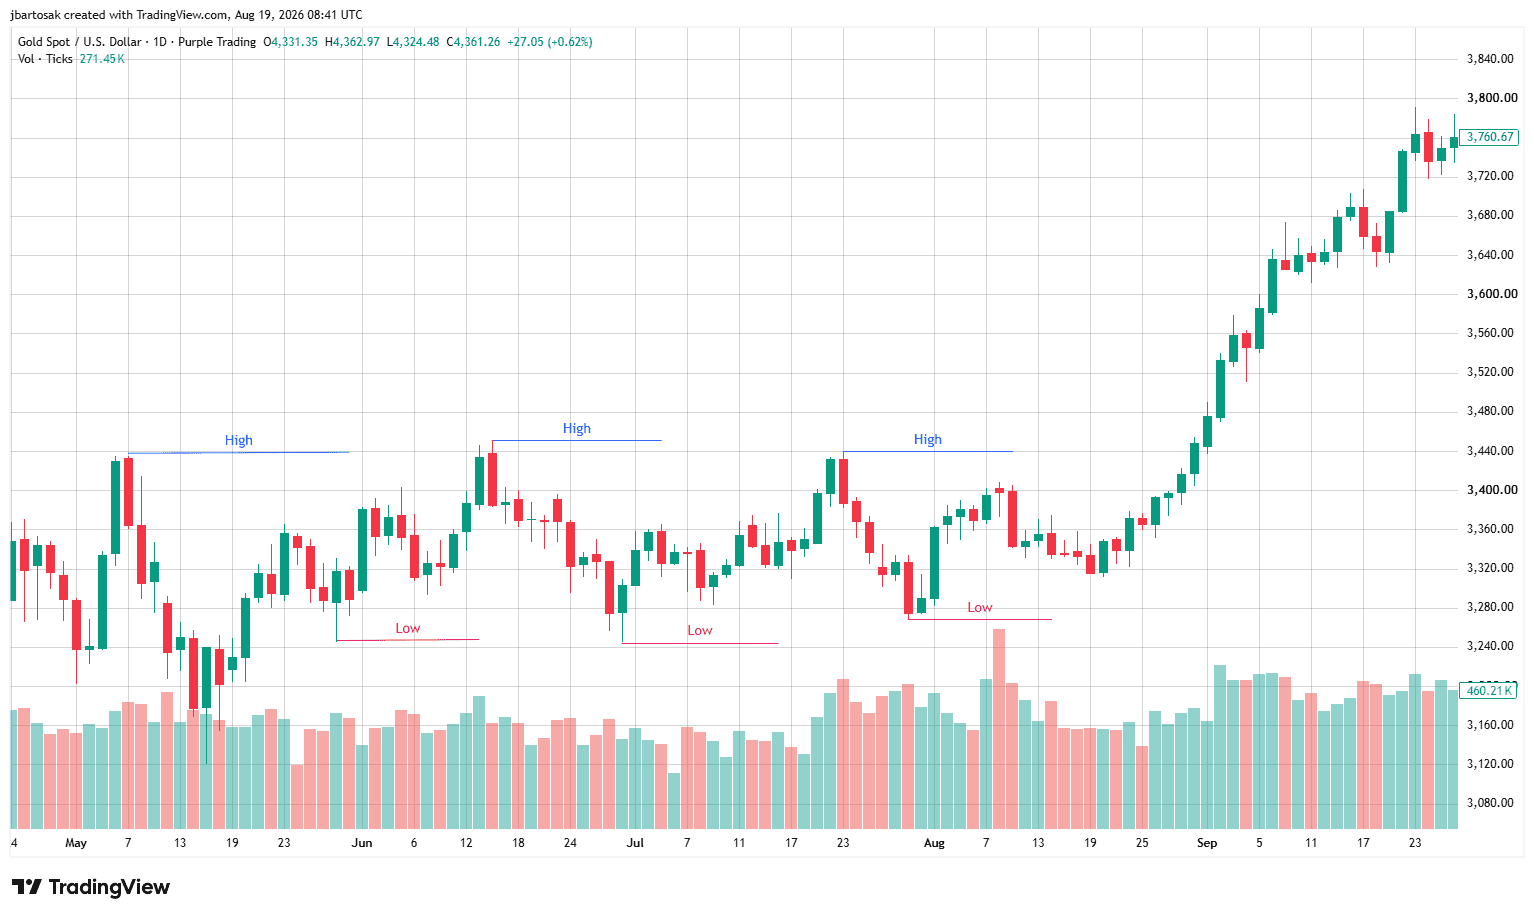
A sideways trend on gold, running from early May to the end of August 2025. Notice the uptrend kicking in afterward? That's the one from the screenshot above.
Why trade in the direction of the trend?
"The trend is your friend." You've probably heard that line a hundred times, and there's real truth to it. Trading with the trend means moving with the market's dominant force, not against it. For a beginner, that's a much safer approach, since the risk of stepping in against a strong move is lower. And the market tends to keep going in its direction longer than you'd expect. Who does that work in favor of? You, of course!
Curious what's inside?
Create a free account and explore the Fintokei zone — loyalty rewards, dashboards, refer a friend and more. No challenge required.
Why does it matter to spot a trend reversal?
Miss a reversal, and you suddenly find yourself in a position against the market's new direction: your loss grows, and you watch your virtual capital shrink as you edge closer to your loss limit. But it cuts both ways: spot a reversal that isn't really there, and you might close a perfectly good position way too early. Recognizing a reversal correctly isn't a nice-to-have. It's a core skill you can't do without long-term.
How is a trend reversal different from a pullback?
A pullback is a short stumble against the trend, after which price returns to its original direction. A reversal is something else entirely: a lasting change in direction. You can tell them apart by the depth of the move, trading volume, and whether price breaks through a key support or resistance level, or just bounces off it and carries on.
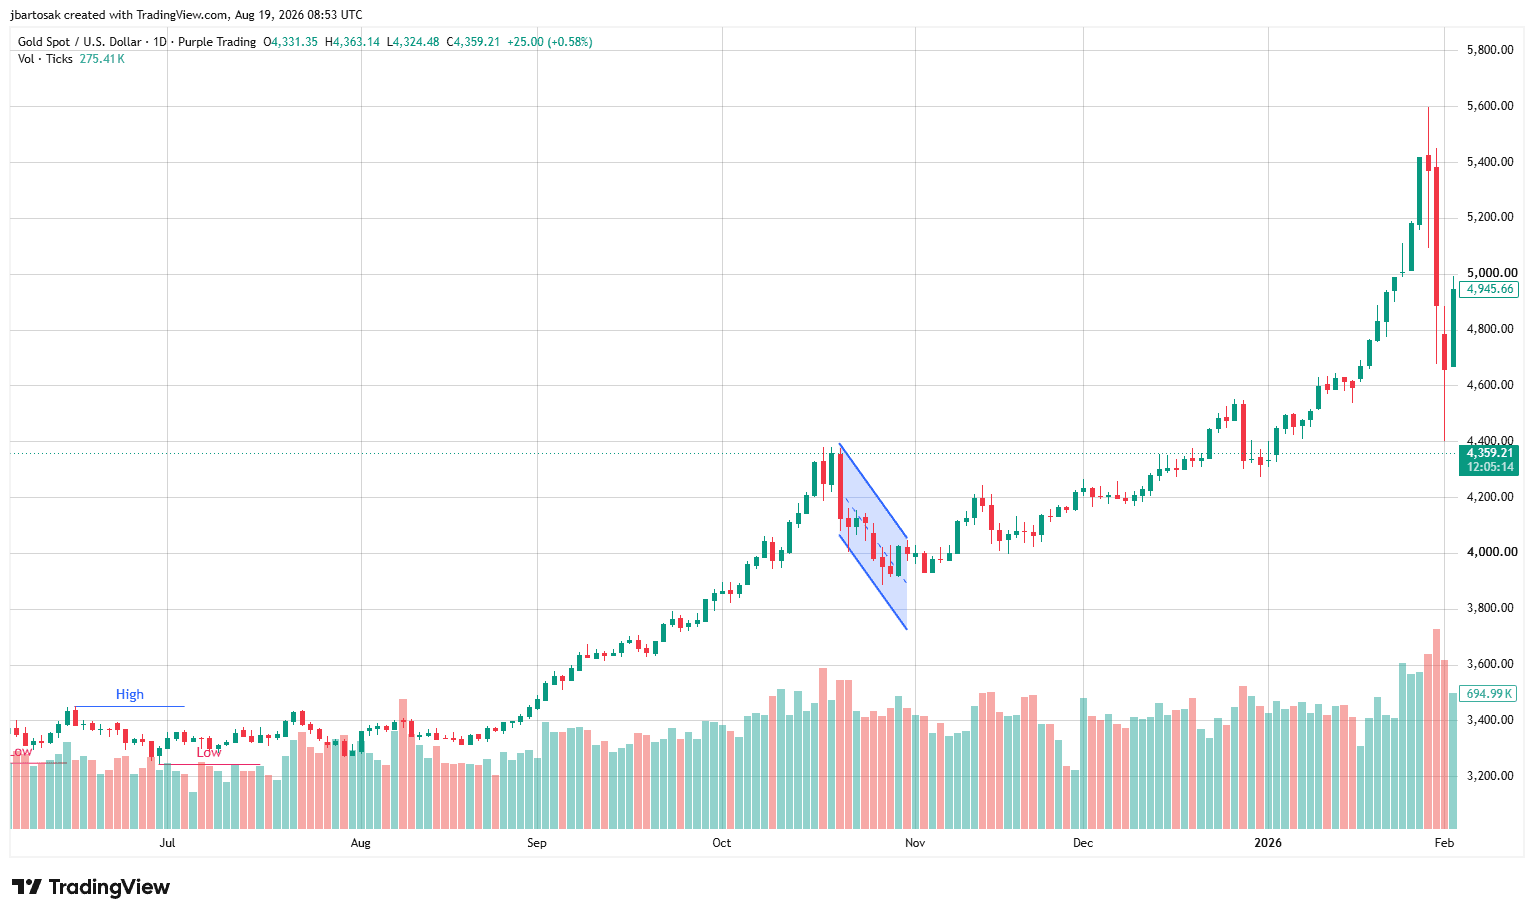
A pullback on gold, running from October 21 to October 31, 2025.
Which candlestick patterns signal a trend reversal?
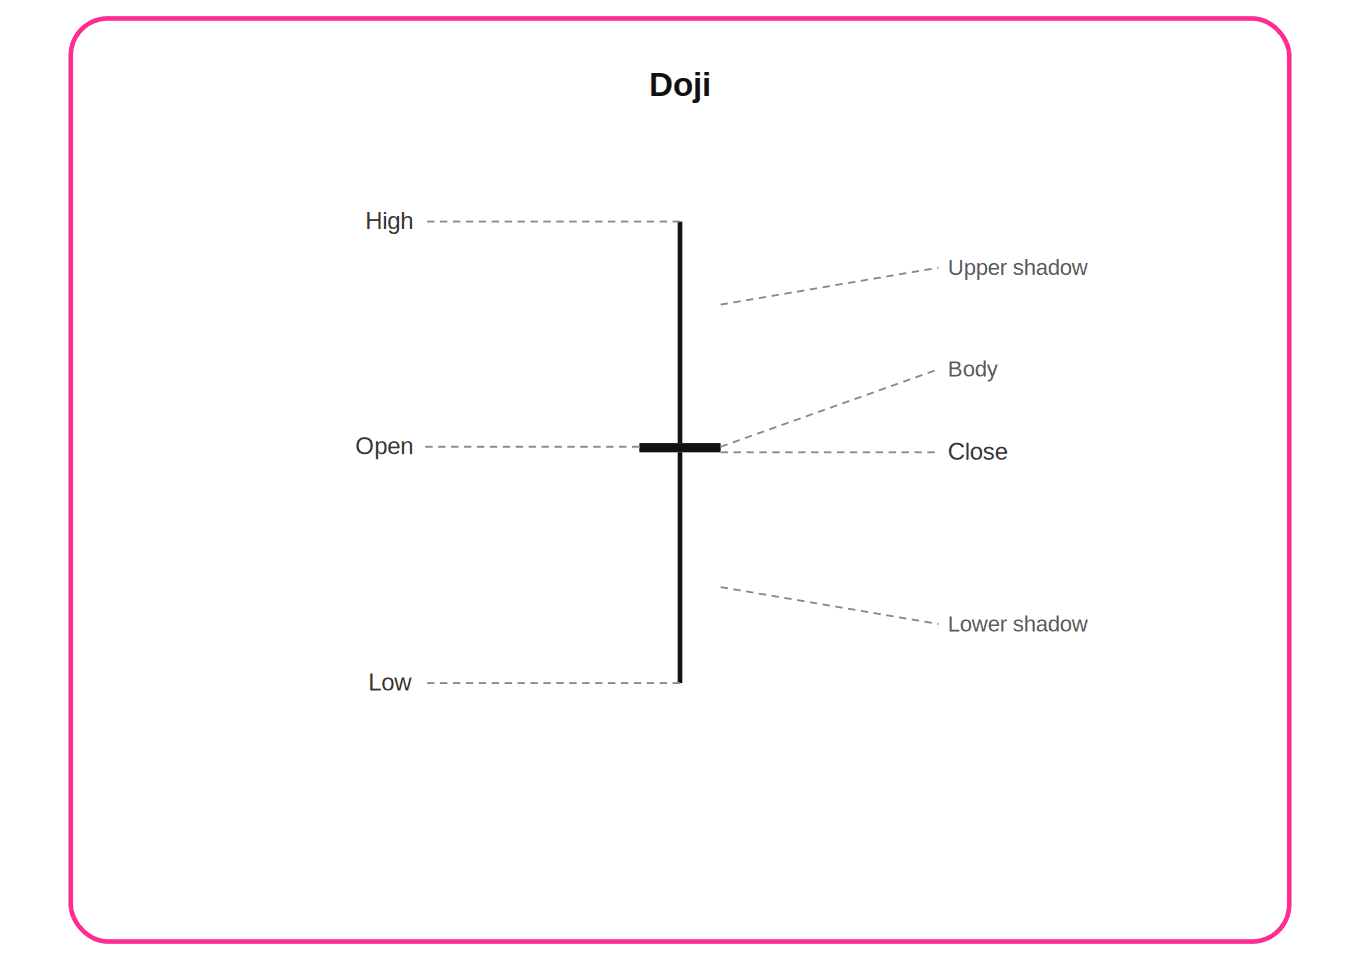
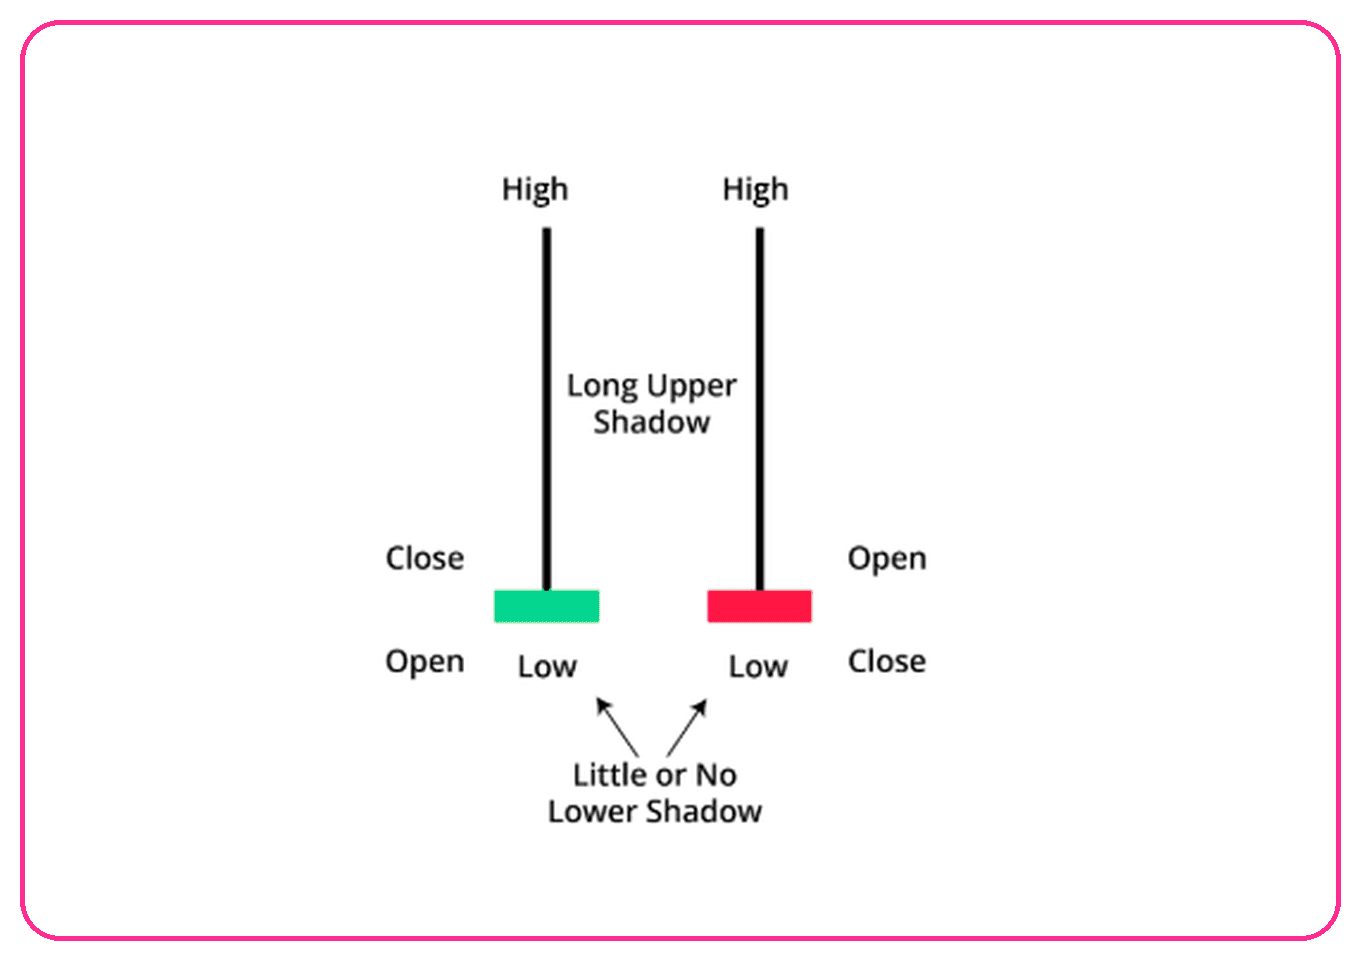
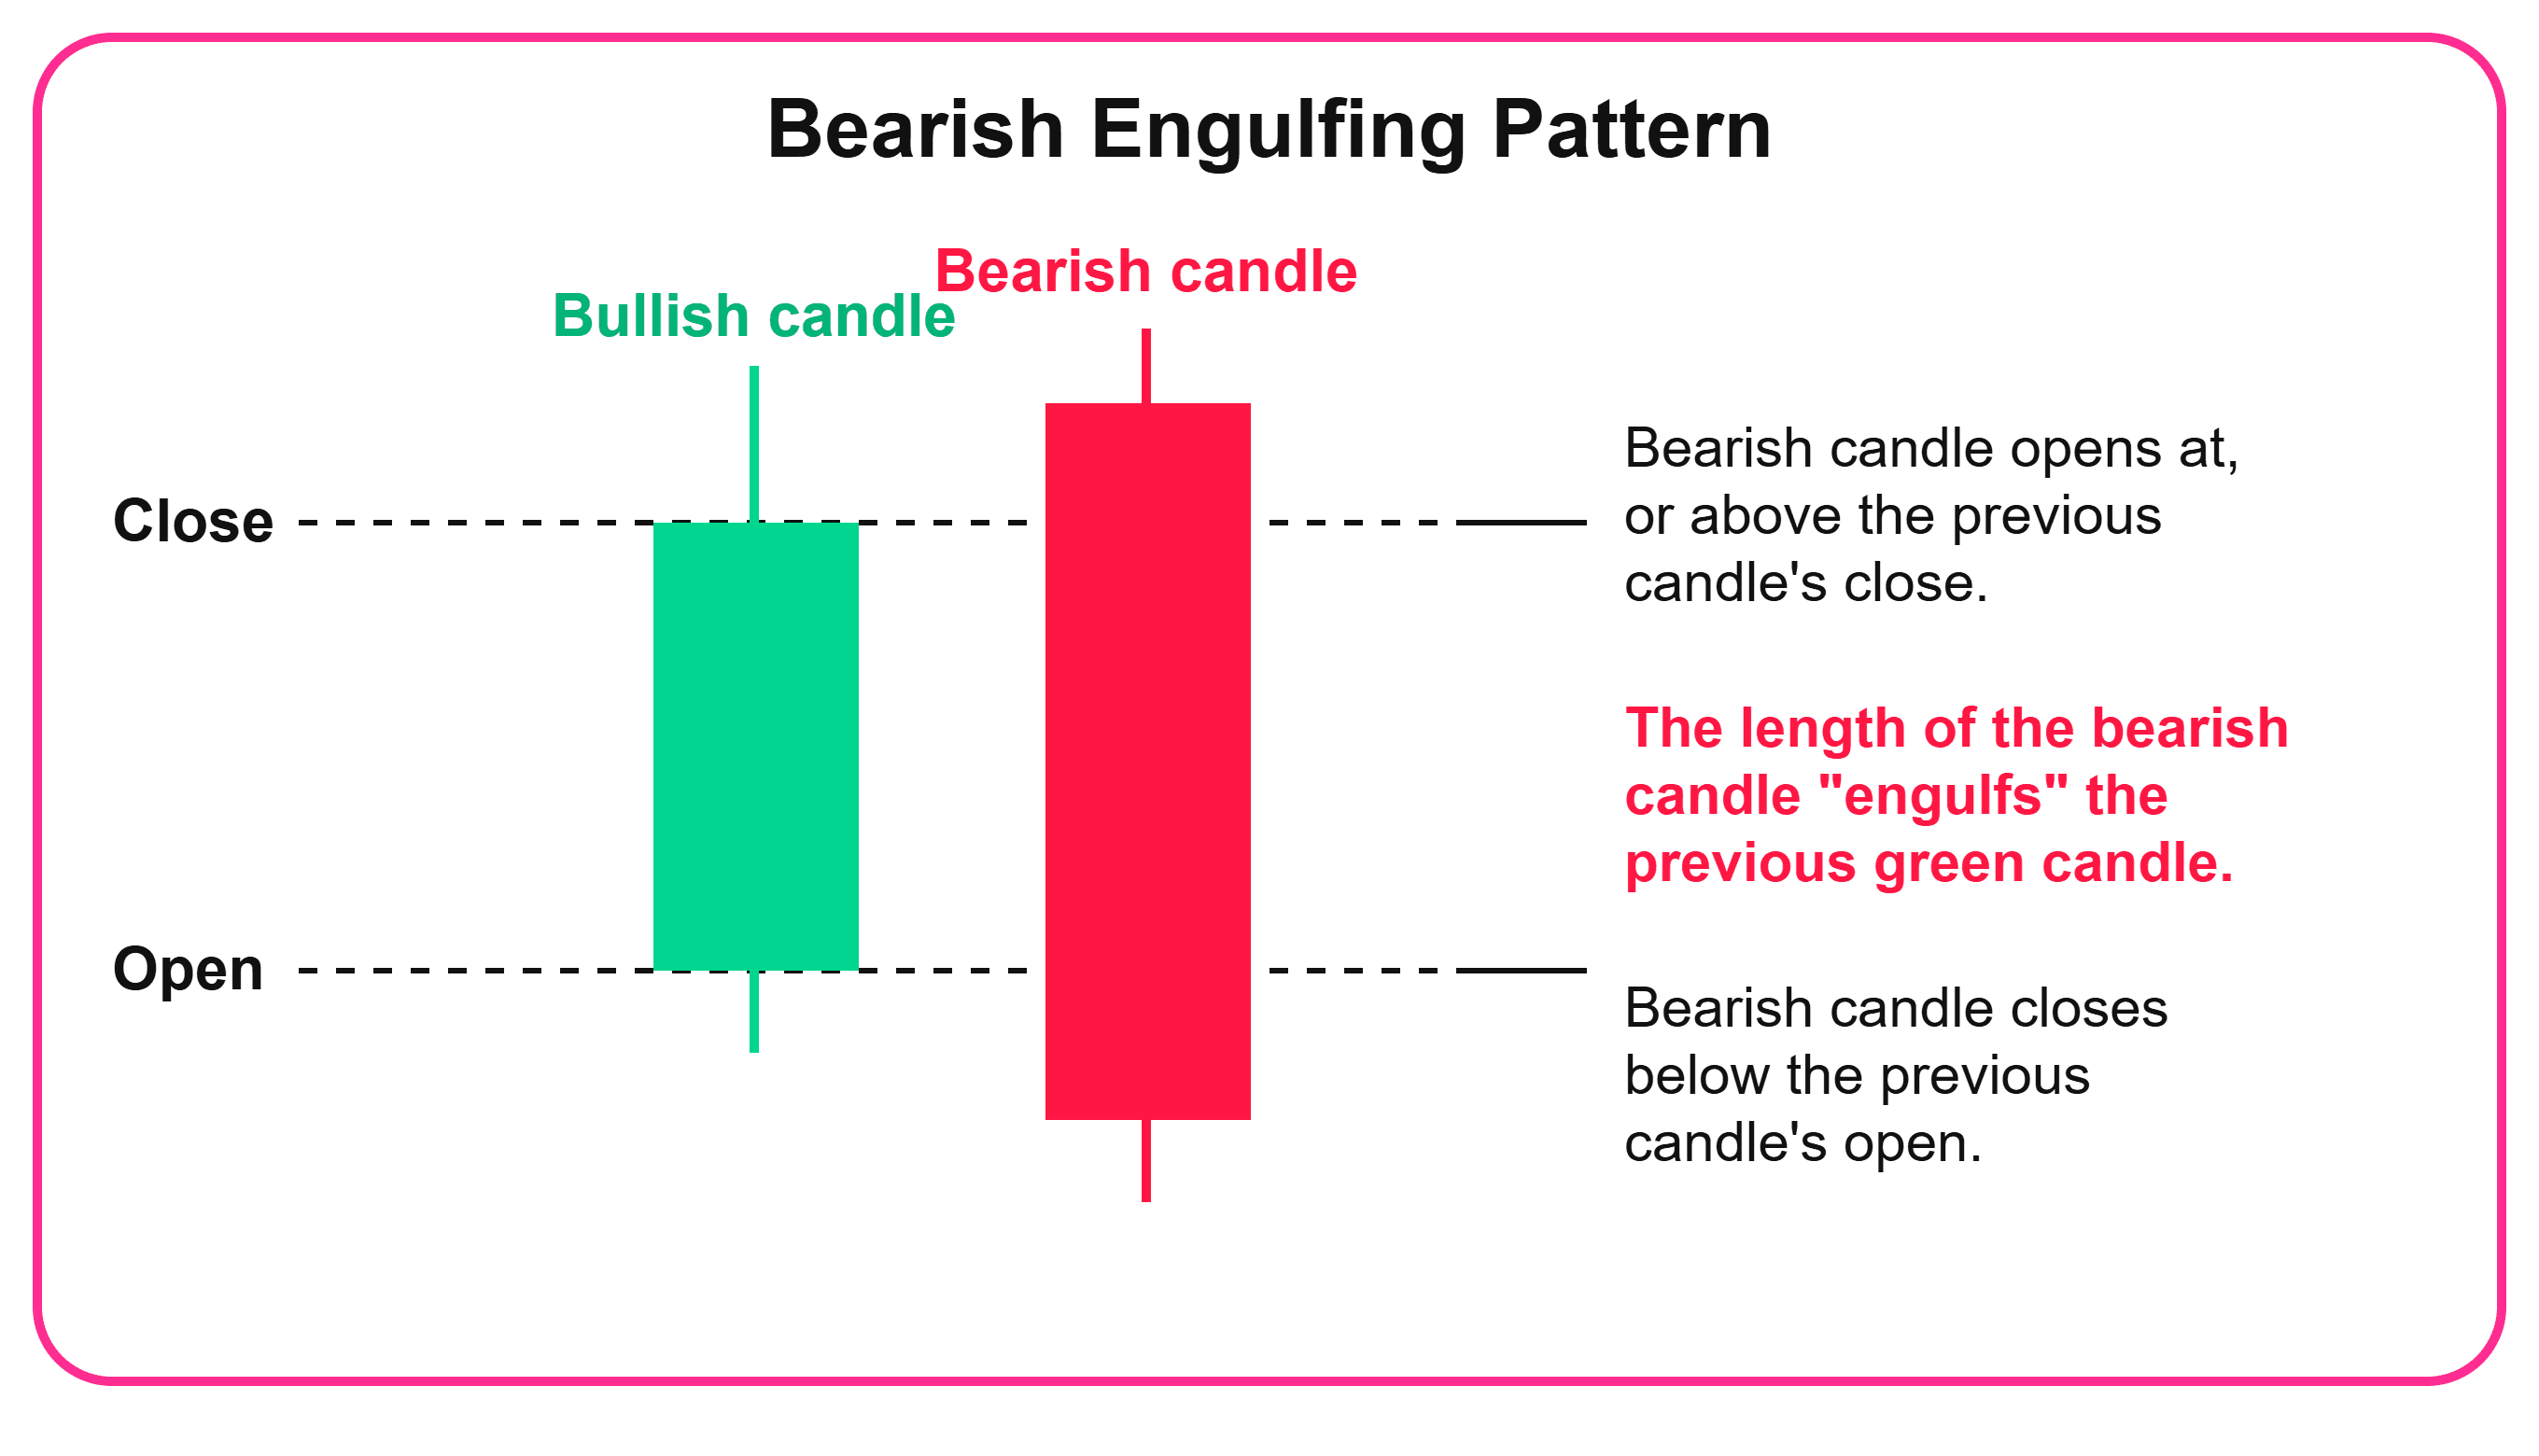
The most reliable crew of reversal patterns? Doji, Hammer, Shooting Star, and the Engulfing pattern. Each one shows the balance of power between buyers and sellers tipping to the other side. But watch out – a pattern alone doesn't guarantee anything. It needs confirmation from further price movement, ideally backed by higher volume too.
How to predict a trend reversal using technical analysis?
Besides candlestick patterns, indicators can help you spot a reversal too. RSI shows whether the market is oversold or overbought, moving averages flag crossovers that can signal a shift in direction, and don't forget trading volume either. The strongest signal comes when several indicators line up at once and get confirmed on a higher timeframe too.
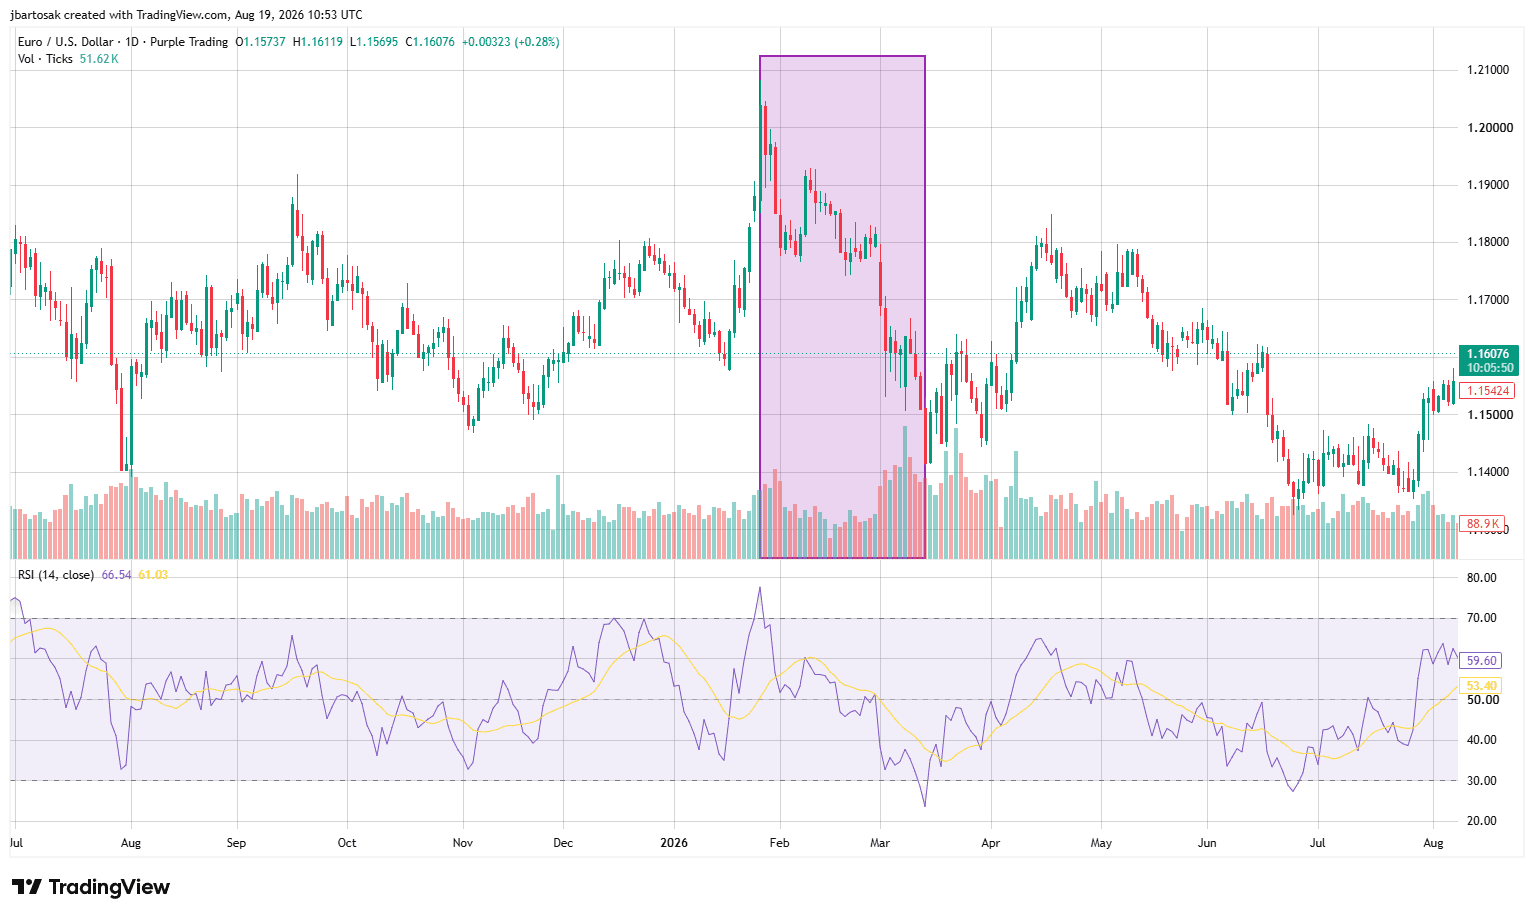
RSI pointing to a reversal at the start and end of a downtrend. Notice how the RSI line is close to 80 at the start, and nears the lower 20 boundary by the end.
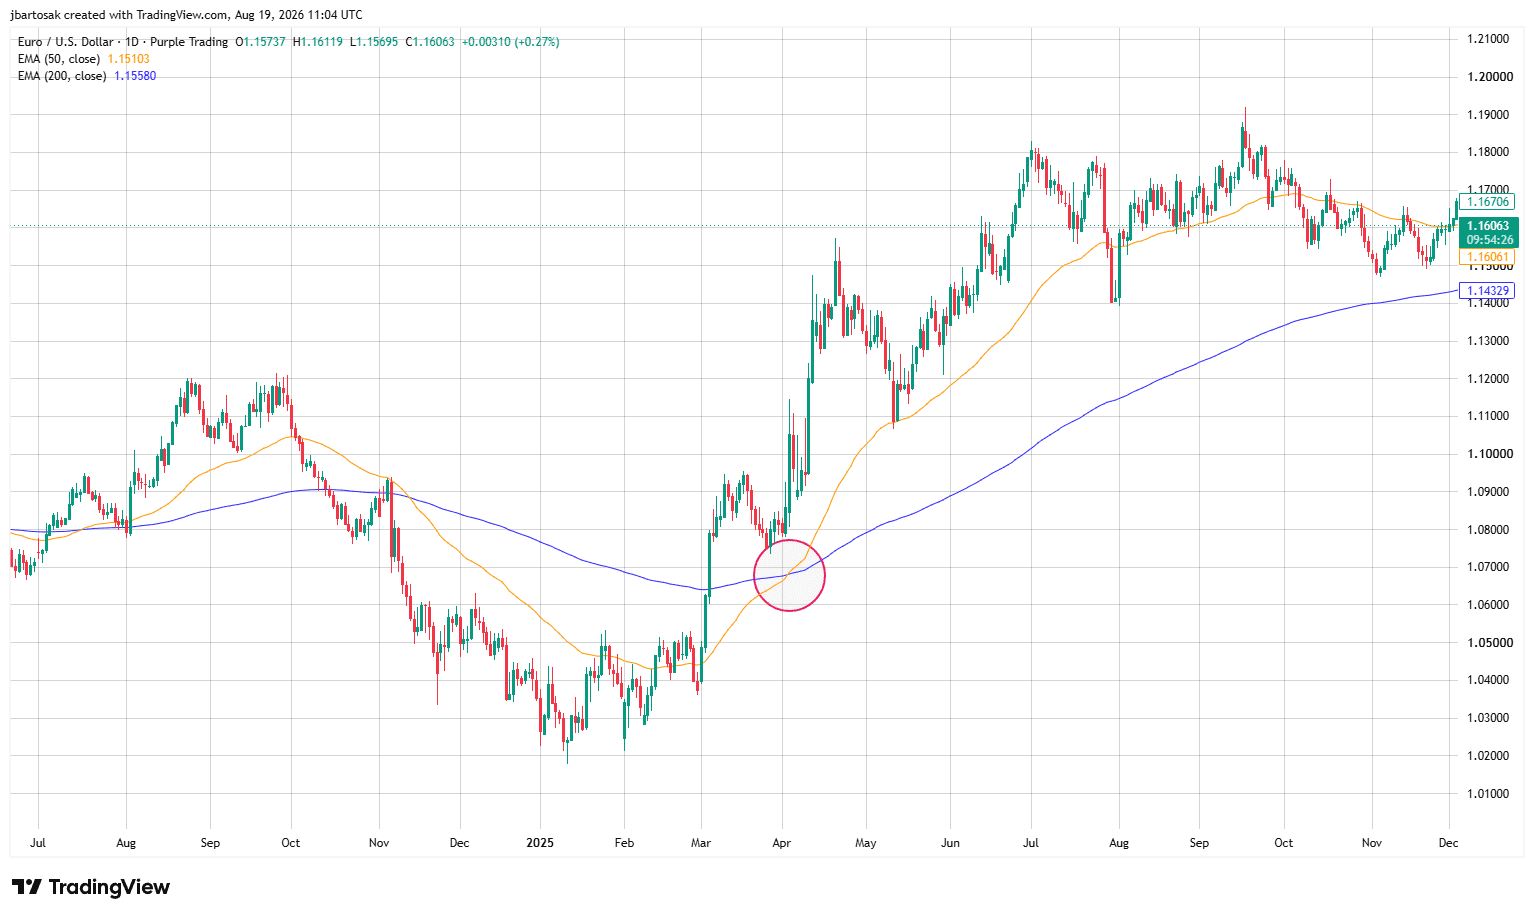
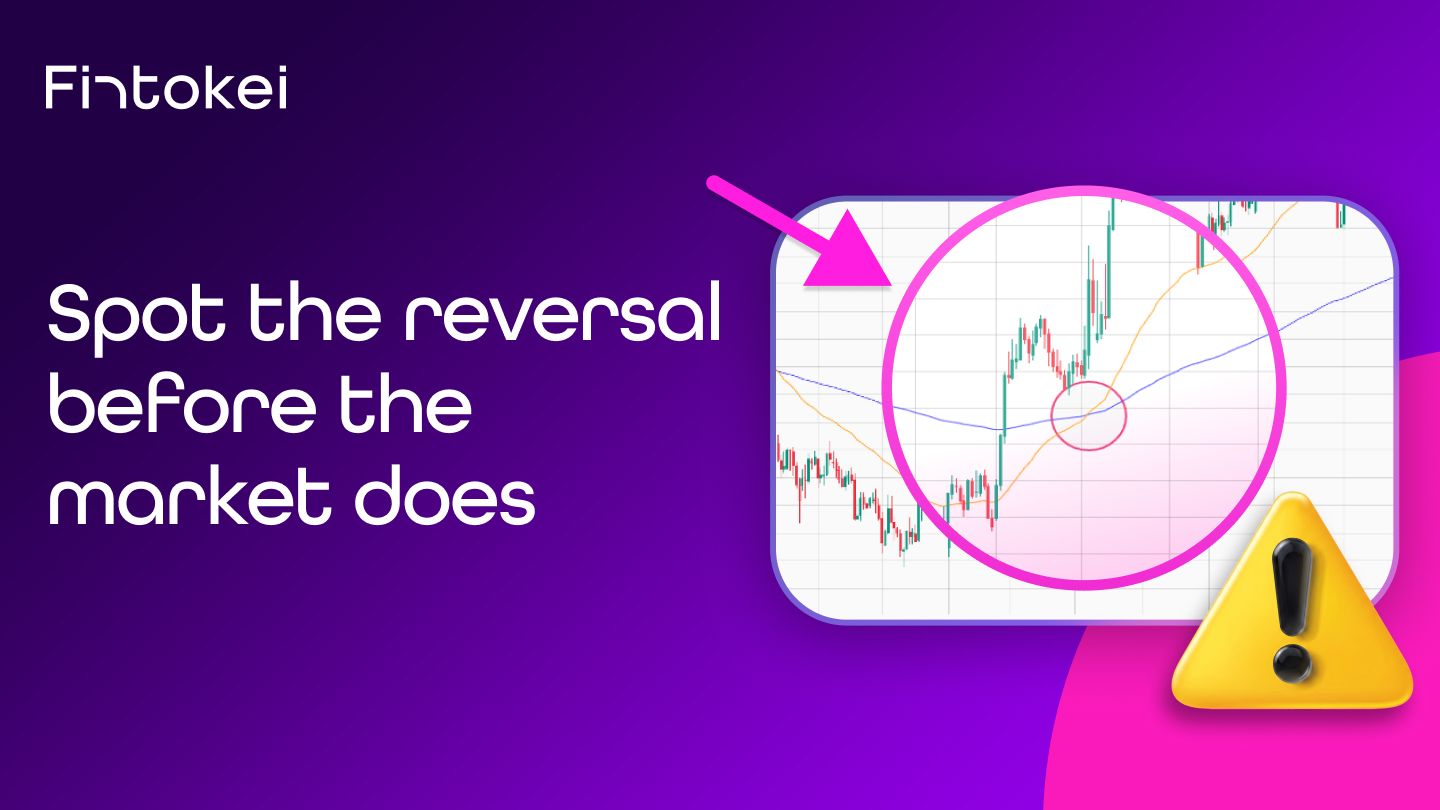
EMA50 crossing above EMA200 from below – the so-called golden cross – often signals the start of an uptrend.
What fundamental factors can cause a trend reversal?
Trend reversals are often kicked off by macroeconomic news too: central bank interest rate decisions, inflation data, or company earnings. Fundamentals aren't as precise as technical analysis, but they're great at explaining why a technical signal showed up right now instead of a week earlier.
Why is swing trading the ideal way to trade trends?
Swing trading gives you something day trading often lacks - time. You hold positions for days to weeks, so you've got room to wait for confirmation of a trend, and of its reversal too. You don't have to react to noise on lower timeframes, and the number of false signals drops. It's no accident this is the style behind some of Fintokei's most successful traders.
Bernd from Germany is one of the Fintokei Stars, and he's certainly among our most successful swing traders. His strongest move? He bet on a decline in silver after price failed to break through a key resistance level. He held the position for over three weeks with a solid dose of patience and closed it out with a profit of over $30,000. In total, he's earned more than $60,000 from Fintokei, paid out within 24 hours. Check out how Bernd trades.
Sebastián is another Fintokei Star who swears by swing trading, and he's already racked up 7 payouts. He's never in a rush to jump into a trade – he'll happily wait until price reaches exactly his zone. His recipe? Top-down analysis: he first checks the higher timeframe to see where the market is actually heading, then finds his precise entry on the lower chart. Read his story.
How to start swing trading with ProTrader Swing?
ProTrader Swing is a Fintokei challenge built specifically for swing traders. It lets you take on the markets at a slower pace, without taking on unnecessary risk. And once you're in a trade, you don't have to worry about a short-term move against you knocking you out of the game – short-term drawdowns on open positions don't count toward your daily loss limit. Add swap-free trading on top, and you'll understand why swing traders like Bernd and Sebastián swear by ProTrader Swing.
Trade the next trend reversal with the ProTrader Swing challenge and go after payouts worth telling stories about!
Plus, use code NEW20 for 20% off your first purchase!
Frequently asked questions
How long does it take to confirm a trend reversal?
It could take just a few candles, or it could take a few days – it depends on the timeframe and the strength of the signal. The higher the timeframe you watch, the more reliable the confirmation, but you'll need patience.
Is a Doji a reliable reversal signal?
Not on its own. A Doji only shows that buyers and sellers are currently tied in a tug-of-war, with neither side in control. It becomes more reliable once paired with further confirmation, like rising volume or another strong price move.
How do I tell the difference between a reversal and a pullback?
A pullback is a brief episode after which price returns to its original direction. A reversal is permanent. Watch the depth of the move, trading volume, and whether price breaks through a key support or resistance level, or just bounces off it.
Can I trade trend reversals as a beginner?
You can, but carefully. Trading reversals is trickier than riding a trend, since the risk of a false signal is higher. As a beginner, focus on the trend itself first and just observe reversals – you'll build confidence in spotting them over time.
What's the best timeframe for spotting a trend reversal?
Higher timeframes, like the daily or 4-hour chart, give the most reliable signals. Lower timeframes throw up plenty of false alarms, so they're better suited to fine-tuning your entry than to deciding on the reversal itself.
Trade the next trend reversal with the ProTrader Swing challenge and go after payouts worth telling stories about!
Plus, use code NEW20 for 20% off your first purchase!