5 MT5 Indicators Worth Actually Understanding
MetaTrader 5 ships with over 80 built-in indicators. You will realistically use a handful. These five form the technical foundation that the vast majority of professional traders rely on - across all markets, timeframes, and trading styles.
Every trader eventually tells themselves: "I will trade more strictly, more systematically, without emotions." Then they add an eleventh indicator to the chart. Let those who are without sin cast the first stop loss.
MetaTrader 5 puts powerful tools in your hands, but their strength does not lie in quantity. It lies in how well you understand the ones you actually use. This article deliberately focuses on just five: EMA, RSI, MACD, Bollinger Bands, and Fibonacci Retracement. Each solves a different problem. Each has its blind spots. And each works better when you know when not to use it.
What an indicator actually does — and what it does not
A technical indicator takes historical data (most often price or volume) and recalculates it into a visual output: a line, a histogram, a band. It helps you process information faster than you could with the naked eye.
What an indicator does not do: it does not predict the future. Every indicator is inherently lagging. It reacts to price that has already happened. The more you demand from an indicator, the more disappointed you will be. The more precisely you know which specific question it answers, the better you will use it.
⚠️ MT5 displays indicators in real time, but seeing a signal is not enough — you have to understand it. A misinterpreted indicator is worse than no indicator at all.
💡 Fintokei tip
Just getting started with technical analysis? Check out the essential trading concepts you need to know. It will help you better understand what indicators are actually measuring.
Five indicators worth genuinely mastering
Below is an overview. Each one is then covered in detail: how it works, how to read it, and where it most commonly fails.
EMA: the moving average that keeps pace with the market
The Exponential Moving Average (EMA) is a version of the moving average that assigns greater weight to recent prices. The result is straightforward: EMA reacts to market moves faster than the classic simple moving average (SMA) and lags less behind price in a trend.
On the chart, you see it as a single smooth line. When price is running above it and the EMA is rising, the market is in an uptrend. When price is below it and the EMA is falling, the market is in a downtrend. But that is just the basic reading.
How EMA actually works in MT5
MT5 offers four types of moving averages. For the vast majority of situations, reach for EMA. It is a compromise between sensitivity and stability. You set the period on the chart: the lower the number, the faster the reaction — but the more false signals you get.
Golden Cross and Death Cross: When EMA 50 crosses above EMA 200 from below, this is the Golden Cross — a signal that has historically preceded longer-term uptrends. The opposite crossover (Death Cross) warns of a potential decline. Both signals are slow, but powerful.
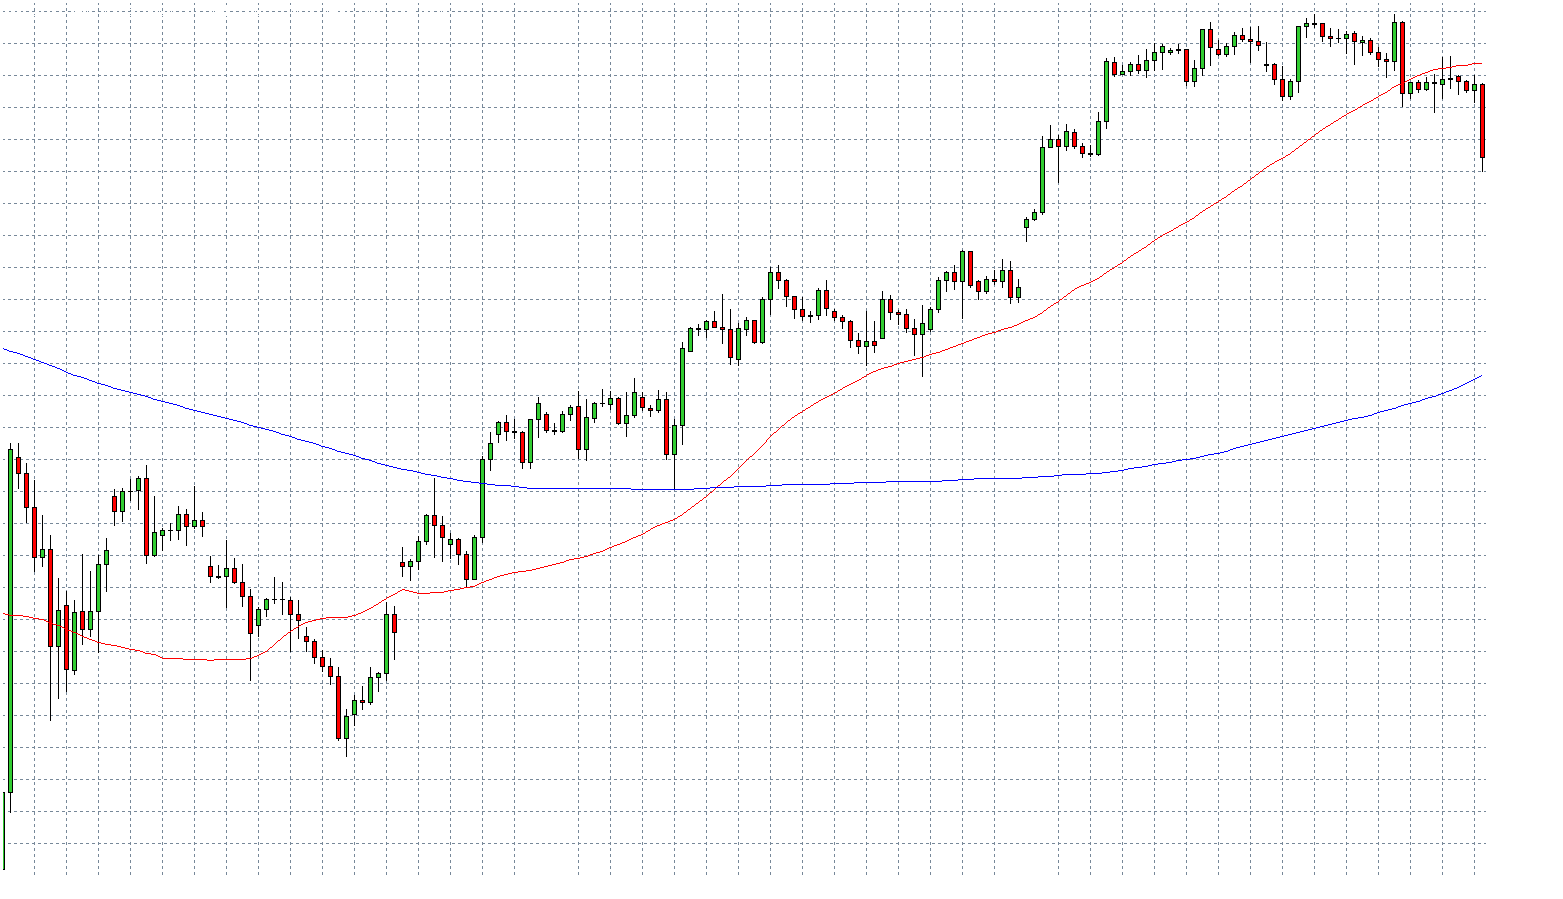
Golden Cross on NASDAQ (H4 timeframe) — uptrend followed
EMA as dynamic support: In a strong uptrend, price repeatedly returns to EMA 20 or EMA 50 and bounces from it. This zone is often an attractive entry point for swing traders looking to go long.
When EMA fails
In a sideways market (ranging), EMA generates false signals one after another. Price crosses it left and right with no directional trend. If you see a flat EMA on the chart that is barely moving, switch to a different tool or wait.
💡 Fintokei tip
Prop trading challenges have strict drawdown rules. EMA 20 works as a simple filter: don't trade against the direction of EMA on the H1 timeframe or higher.
RSI: measures the strength of a move, not just its height
Relative Strength Index (RSI) was developed by J. Welles Wilder in the 1970s and is today one of the most widely used indicators in the world. It moves on a scale of 0–100 and answers one specific question: how strong is the current move relative to historical context?
The traditional interpretation is straightforward: RSI above 70 signals an overbought market, RSI below 30 signals oversold. But that is only part of the story. In practice, the context in which RSI is moving matters more than the raw value itself.
RSI and trend context
Constance Brown described the so-called range rules: in an uptrend, RSI typically oscillates between 40 and 80; in a downtrend, between 20 and 60. This significantly changes how you interpret the values:
Settings in MT5: Insert → Indicators → Oscillators → Relative Strength Index. The default period of 14 is a good starting point for 1H and above. On shorter timeframes, try 9 — more sensitive, but noisier.
Practise reading RSI signals on the Fintokei Free Trial challenge
A risk-free challenge — completely free.
MACD: where trend meets momentum
Moving Average Convergence Divergence (MACD) was created by Gerald Appel in the 1970s. It works with three components simultaneously: two exponential moving averages and their difference. This allows it to show both trend direction and momentum in a single window.
In MT5, you see two lines and a histogram beneath the chart. Each of them says something different:
Three types of signals and their reliability
1. Signal line crossover: the most common signal. MACD crosses the signal line from below (long) or from above (short). Reliable in trending markets, noisy in sideways conditions. Signals close to the zero line carry less weight.
2. Zero line crossover: slower, but stronger. When MACD crosses above zero, the 12-period EMA is above the 26-period EMA — buyers have taken control. This signal works as confirmation, not as a trigger.
3. Divergence: the most difficult, but most valuable. Price makes a new high, MACD does not — the trend is weakening. Or the reverse: price at a new low, MACD holds higher — sellers are losing strength. Divergence is a warning signal, not a direct entry instruction.
💡 Fintokei tip
The most precise MACD setup occurs when the signal line crossover coincides with a zero line crossover. Two conditions met simultaneously equals stronger confirmation. The histogram also shows whether momentum is building or fading — before the crossover itself.
Bollinger Bands: a framework for reading volatility
John Bollinger designed these bands in the 1980s on a simple principle: price moves within a definable range most of the time. The middle line is a moving average (SMA 20), and the upper and lower bands are placed two standard deviations away. The higher the volatility, the wider the bands. The calmer the market, the narrower.
The classic beginner mistake: treating Bollinger Bands as an overbought/oversold signal. Selling when price reaches the upper band, buying when it touches the lower. In a trending market, this strategy will reliably cost you money — price can ride along a band for weeks.
What Bollinger Bands actually show
Squeeze as a trading setup: A squeeze occurs when the bands narrow to a historically low value. The market stops reacting and quietly prepares. Bollinger Bands alone will not tell you when the breakout will come or in which direction — always combine with confirmation: volume, RSI, or a price action pattern.
💡 Fintokei tip
Bollinger Bands and RSI complement each other naturally: BB squeeze + RSI near 30 = potential long setup. BB squeeze + RSI near 70 = potential short setup. Always wait for confirmation.
Fibonacci Retracement: the mathematics that became self-fulfilling
Fibonacci Retracement stands slightly apart from the other indicators. Technically it is a drawing tool, not a calculated indicator. But its influence on the trading decisions of millions of participants makes it one of the most important tools in existence.
The principle is simple: after a strong move, the market typically retraces part of the way back before continuing. Fibonacci levels mark where this correction most commonly stalls. They are derived from the mathematical ratios of the Fibonacci sequence — most notably the golden ratio (1.618), whose reciprocal is 0.618, or 61.8%.
How to draw and read Fibonacci in MT5
Insert → Objects → Fibonacci Retracement. In an uptrend, drag from the swing low to the swing high. In a downtrend, reverse the direction. MT5 automatically draws horizontal lines at the key levels.
Why 61.8% works: Because it is watched by thousands of traders and institutions worldwide. That makes it self-fulfilling: as price approaches 61.8%, orders cluster and the market genuinely reacts. It is not magic — it is the coordination of millions of decisions at the same price point.
Confluence zones: Fibonacci alone is not enough. The strongest setups arise when a 61.8% level overlaps with another S/R reference — a previous high or low, EMA 50, a consolidation area. The more tools that point to the same price, the stronger the potential reaction.
💡 Fintokei tip
Not sure which Fintokei challenge to choose? We'll help you decide on our blog.
How to combine these indicators without cluttering your chart
None of these five indicators works as well in isolation as it does alongside the others. At the same time, adding more indicators does not improve accuracy — it creates noise. The key is to select tools that cover different dimensions of the market rather than confirming the same thing twice.
Which indicators suit your trading style?
⚠️ In prop trading challenges, the goal is not to maximize the number of trades — it is to follow the rules. Use indicators as a filter, not a signal generator. Fewer trades, higher quality.
5 MT5 indicators that are worth genuinely mastering
EMA, RSI, MACD, Bollinger Bands, and Fibonacci Retracement are not the most popular MT5 indicators because they are the most sophisticated. They are popular because they work — provided you understand them well enough to know when to use them and when to step back.
Each does one thing well. EMA holds the trend. RSI measures the strength of a move. MACD shows when that strength is shifting. Bollinger Bands tell you whether the market is moving or sleeping. Fibonacci shows where to enter during corrections. Combine them so each one answers a different question — never the same one twice.
Adding an indicator to a chart takes a second. Understanding what it is genuinely telling you takes months. But that is exactly where the difference lies between a trader who reacts and a trader who understands.
Trade on MetaTrader 5 — the platform trusted by millions of traders
Fast order execution, advanced charts, and automated strategies. Everything you need, in one place.