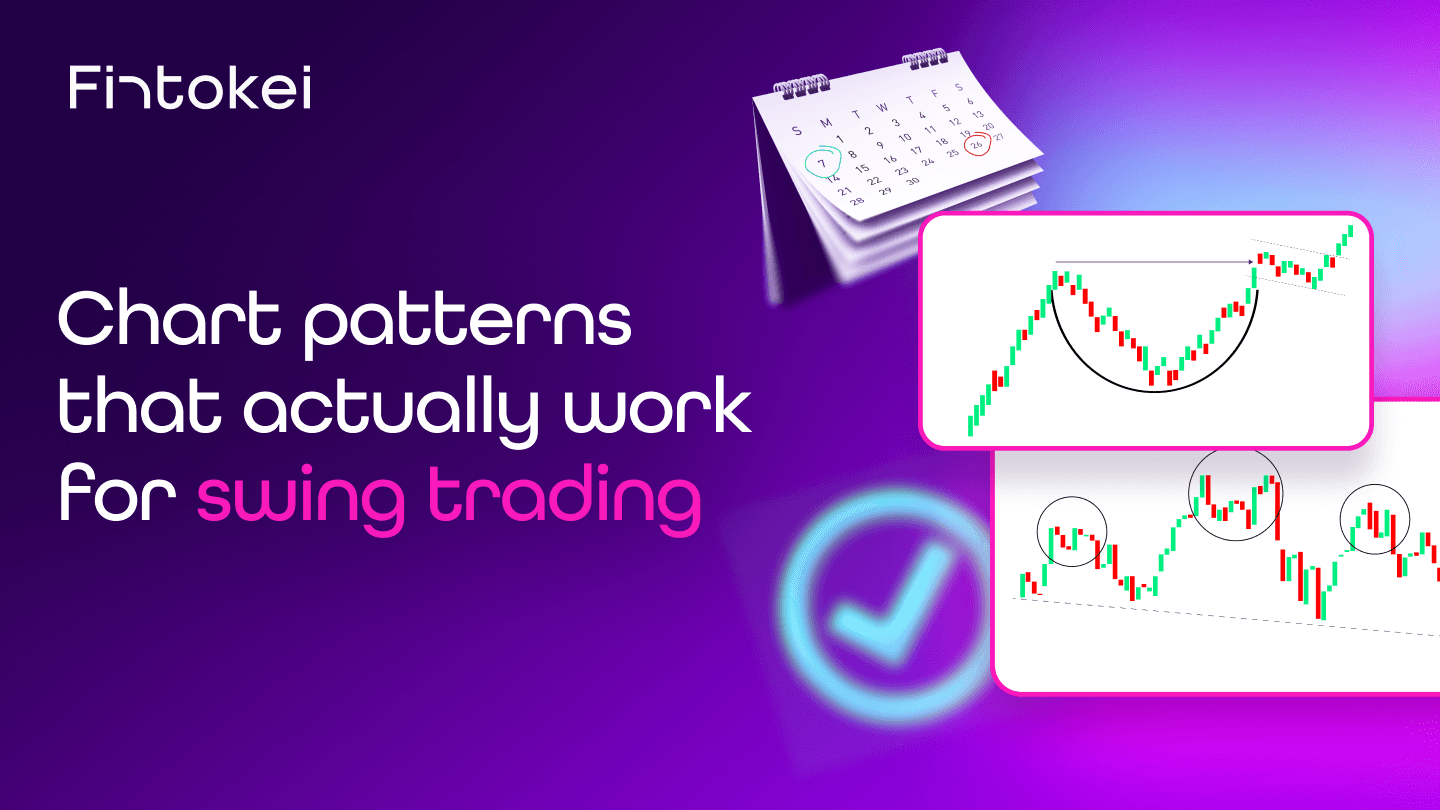
Chart Patterns and How to Trade Them
Every pro started with these, and many still swear by them today. Chart patterns are the foundation of technical analysis, and this article will guide you through them.

Chart patterns are recurring groupings of candlesticks that signal either a trend reversal (like head and shoulders) or a continuation (like flags or triangles). They help you anticipate where the price might move next, and they're one of the foundational skills that also come in handy when working through a Fintokei challenge.
What Are Chart Patterns?
Chart patterns (or trading chart patterns) are unique groupings of candlesticks on a technical analysis chart. Unlike simple candlestick patterns, they span more candles and take longer to form.
Why care about them? Because chart patterns trading helps predict where the price is heading. Whether you're trading stocks, commodities, or forex, identifying chart patterns gives you insight into whether the market is about to reverse or continue its trend.
Before diving into these patterns, ensure you know the basics of candlestick trading. Each candle tells a story about price movement, from the opening to the closing price, and even the market's highs and lows.

How do chart patterns help with trading decisions?
Trading chart patterns is not just about finding random shapes on the chart. Each pattern gives you insight into the current market sentiment. Some patterns indicate indecision, others confirm price direction or signal a reversal. You'll often use trend lines to identify chart formations. We've also covered how to correctly identify a market trend on our blog.
For example, chart patterns that last for a longer period of time (perhaps even dozens of candles) are much more reliable than those that occur over a short period. That's why it's a good idea to use them as part of a comprehensive trading chart analysis.
What do chart patterns reveal about market psychology?
Think of a chart as a battlefield between buyers and sellers. Rising prices? Buyers dominate. Falling prices? Sellers have the upper hand. This battle is reflected in each candle.
For instance, a "Doji" candle (shaped like a plus sign) signals indecision—traders are waiting for the market to pick a direction. Larger patterns, like "Head and Shoulders" or "Double Bottom," narrate the bigger picture of trend evolution.


💡 Fintokei tip
Our free chart patterns ebook covers all the key patterns in one place, along with tips on how to trade them.
What are the main types of chart patterns?
Reversal Chart Patterns:
These show that the current trend is likely to change direction. Examples:
- Double Top: Signals the price may drop after reaching a peak twice.
- Head and Shoulders: Suggests a market trend is about to reverse.
Continuation Chart Patterns:
These confirm that the current trend will keep going. Examples:
- Flags and Pennants: Compact patterns that suggest the trend will resume after a brief pause.
- Triangles: Often used in chart patterns forex trading to indicate consolidation before a breakout.
How do you trade chart patterns like a Pro?
To trade these patterns:
- Spot the pattern early.
- Plan entry, exit, and stop-loss levels.
- Combine patterns with other tools like technical indicators for better accuracy.
- Practice chart patterns on a Fintokei Free Trial.
Remember, no pattern is 100% reliable. Always use them alongside other analyses to improve success rates.
Start spotting chart patterns on your trading chart today! With consistent practice, you'll learn to identify profitable opportunities and enhance your trading skills.
Unleash your trading potential on Fintokei accounts too!
FAQ
Are chart patterns suitable for passing a Fintokei trading challenge?
Yes, chart patterns are one of the core technical analysis techniques you can use while working through a Fintokei challenge. They work best combined with other tools, like risk management or indicator confirmation, rather than as a standalone trade signal.
What's the difference between a chart pattern and a candlestick pattern?
A candlestick pattern forms from just one to three candles and gives a signal quickly. A chart pattern is a more advanced tool — it's built from dozens of candles and takes much longer to form, which usually makes it more reliable but slower to confirm.
Which chart pattern is the most reliable?
There's no universally "most reliable" pattern — reliability always depends on context, how long the pattern took to form, and the market it appears in. As a general rule, patterns that take longer to develop (even dozens of candles) tend to be more trustworthy than ones that form quickly.
How long does it take for a chart pattern to form?
Unlike candlestick patterns, which form over just one to three candles, chart patterns need much more time — sometimes dozens of candles. The longer a pattern takes to develop, the more reliable its signal tends to be.
Is a chart pattern enough on its own to make a trading decision?
No, no pattern is 100% reliable on its own. It's always worth combining it with other tools, like technical indicators, trend lines, or fundamental analysis, to improve your odds of a successful entry.

Part of the support team, focused on solving your issue before you even type “payout.” Outside of work, you’ll probably find me in a park with a book or sitting in a cinema, quietly analyzing the plot like it’s a price chart. Favorite platform: MetaTrader. Favorite challenge: ProTrader.