


Market Sector Scanner: U.S. Midterms, Jobs Data and Rate Hike Expectations
U.S. midterms, jobs data and expected RBA and BoE rate hikes take centre stage as AI concerns weigh on stocks, gold hits a one-year low and oil stays above $100.

The Fed, ECB and BoJ all kept interest rates unchanged. Two Fed members favored a hike, but Chair Kevin Warsh gave little guidance on December. U.S. and eurozone growth beat forecasts, while Tokyo core inflation matched expectations at 2.6%, above the BoJ's 2% target. Global stocks reversed early gains as investors questioned whether AI spending would deliver enough profit. U.S. bond yields fell, while WTI oil stayed above $100 amid fears of more attacks in the Middle East.
Key Events Calendar
Jump to: Forex Market | Equities | Commodities
Market Outlook
Forex Market
USD/JPY
Last Week Recap
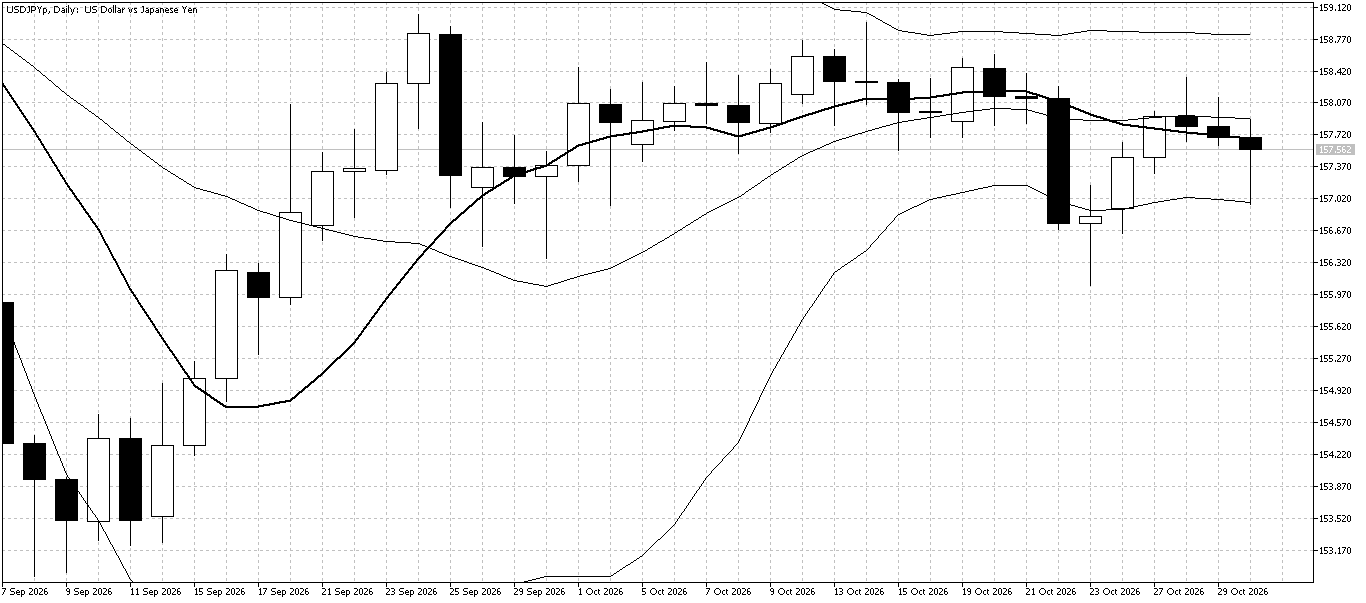
The Fed and BoJ both kept interest rates unchanged, leaving the rate differential intact and helping USD/JPY test higher levels. Resistance remained near 158 as Japanese officials warned of possible intervention to curb yen weakness.
Technical Picture
The Bollinger Bands remain narrow, with the lower band providing support last week. The 10-day moving average is flat, suggesting no clear trend.
Outlook This Week
The market remains balanced, but downside risks appear slightly greater. Range trading with a bearish bias is favoured this week.
GBP/JPY
Last Week Recap
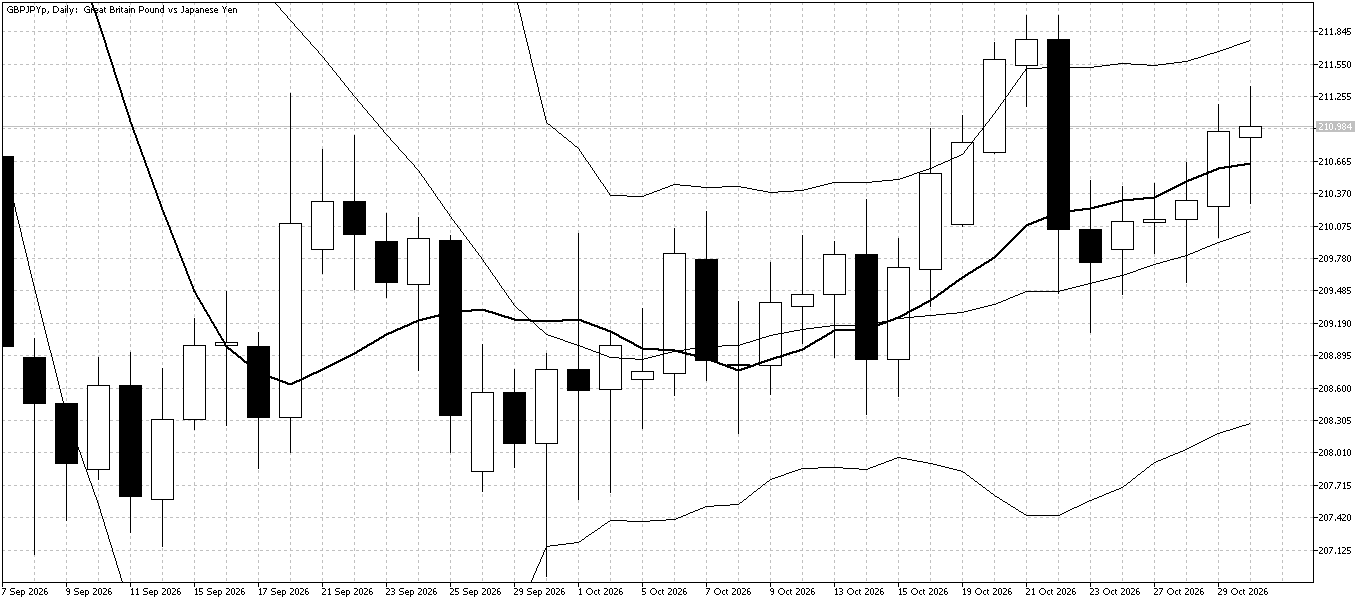
Expectations that the Bank of England will raise interest rates this week supported the pound, helping GBP/JPY test higher levels last week. The prospect of a wider U.K.–Japan interest rate differential continued to attract buyers.
Technical Picture
The 10-day moving average is pointing higher, suggesting the steady uptrend remains intact. However, the upper Bollinger Band provides resistance nearby, which could limit further gains in the short term.
Outlook This Week
Trading remains quiet, but the market continues to move gradually higher. Buying pullbacks towards the 10-day moving average looks favourable, with the Bank of England's decision likely to influence the next move.
EUR/USD
Last Week Recap
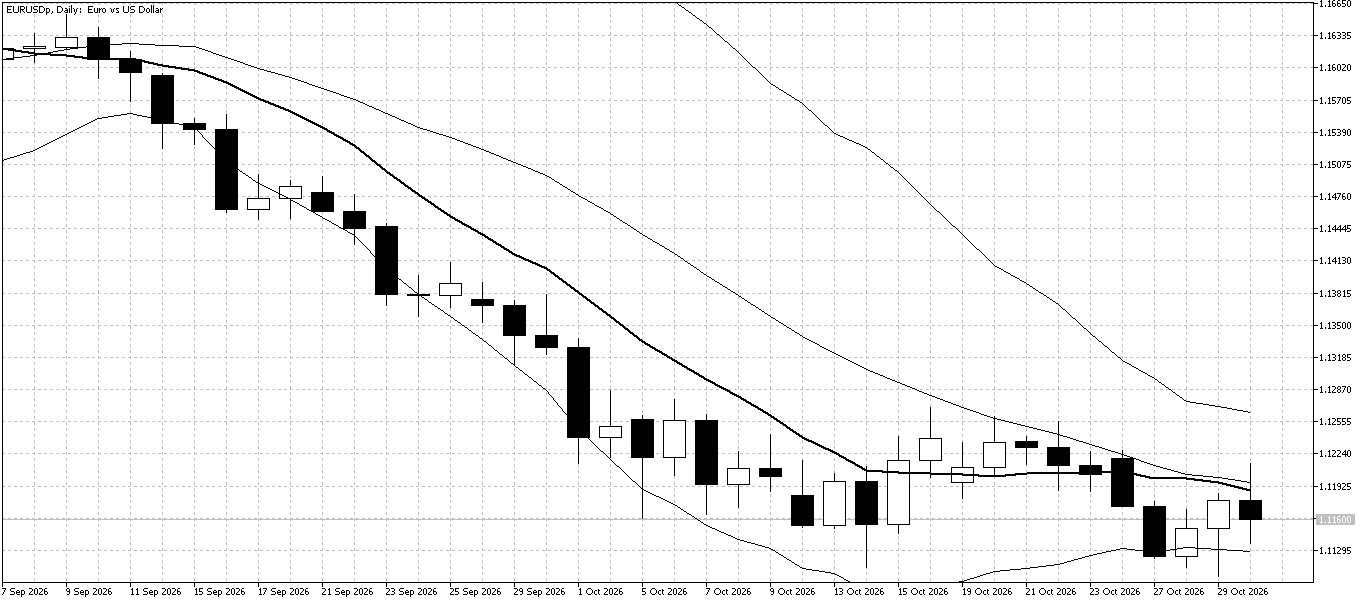
EUR/USD tested recent lows as both the ECB and the Fed kept interest rates unchanged. However, better-than-expected eurozone GDP data supported the euro late in the week, helping the pair recover from its lows.
Technical Picture
The lower Bollinger Band and October lows provided support, but the pair closed below the 10-day moving average again. This suggests the market remains under pressure despite the late-week recovery.
Outlook This Week
Selling rallies towards the 10-day moving average remains the preferred strategy. The October lows are a key support area, with a break below potentially opening the way for further declines.
Equities
U.S. Stock Market
Last Week Recap
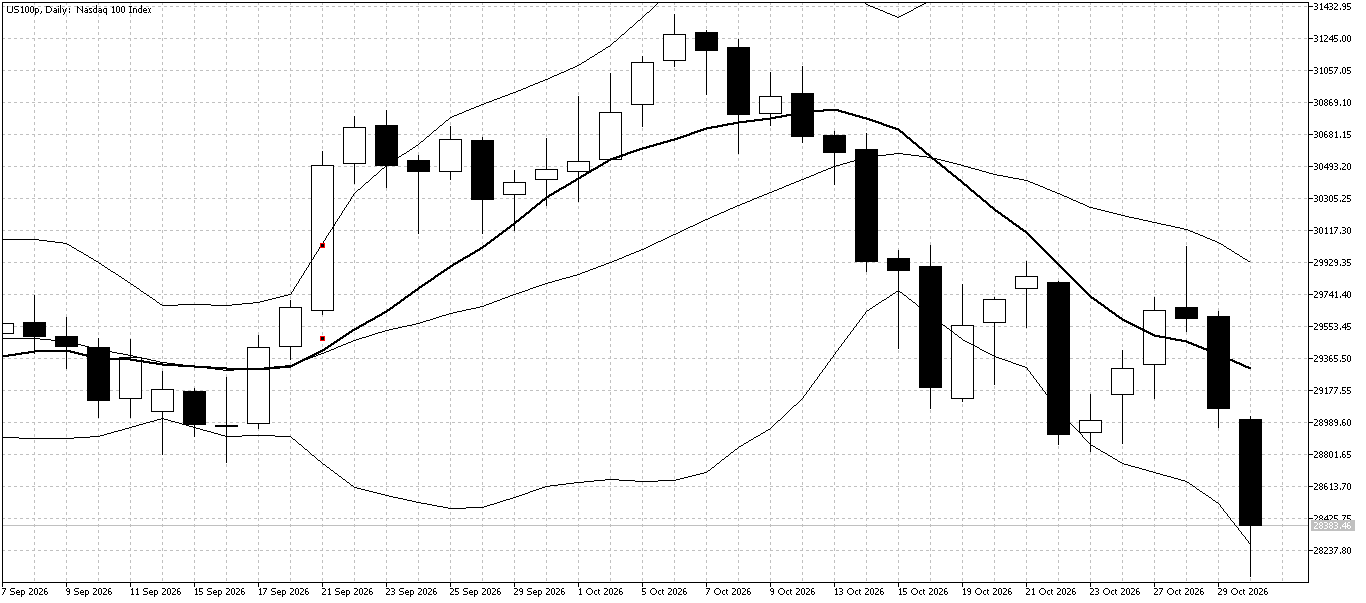
The Nasdaq rose early in the week on strong earnings, but concerns about the profitability of AI investments triggered another sharp sell-off. The index fell nearly 3% late in the week, reversing the earlier gains.
Technical Picture
The 10-day moving average continues to slope lower, highlighting the ongoing downtrend. The sharp decline left the index close to the lower Bollinger Band, where some short-term support could emerge.
Outlook This Week
Selling rebounds towards the 10-day moving average remains the preferred strategy while the downtrend stays strong. Concerns about returns on AI investments could continue to weigh on sentiment and limit any recovery.
Curious what's inside?
Create a free account and explore the Fintokei zone — loyalty rewards, dashboards, refer a friend and more. No challenge required.
Commodities
Gold
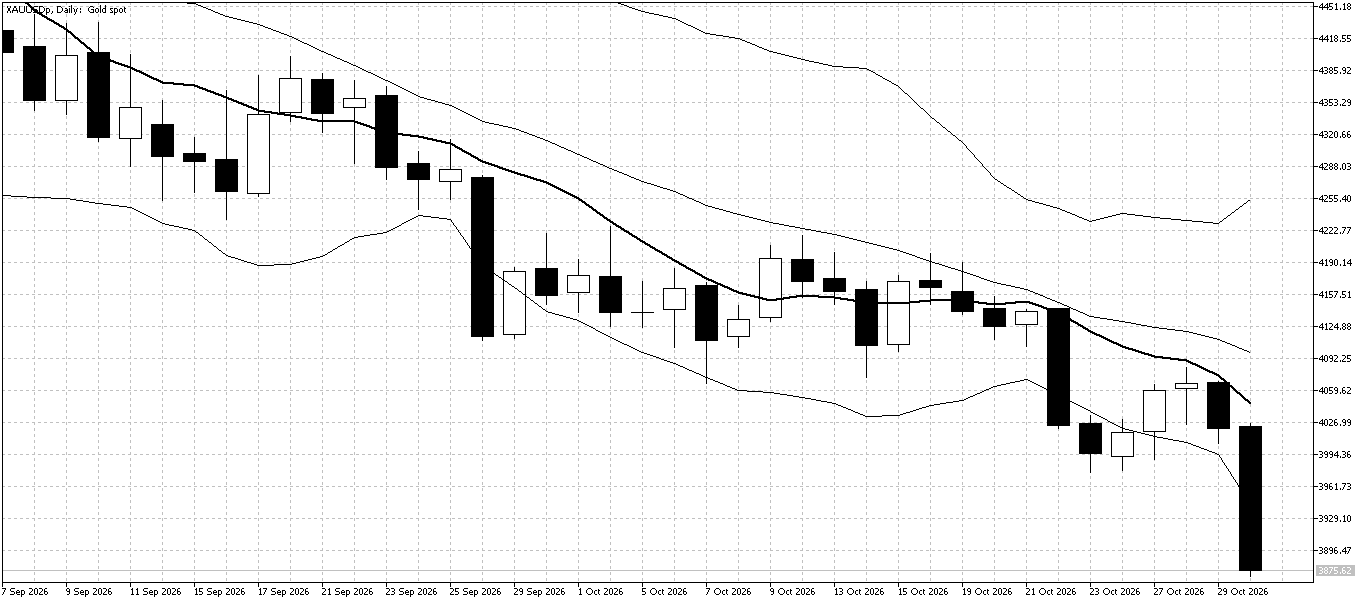
Last Week Recap
Gold fell further as expectations of a U.S. rate hike in December weighed on prices. Higher oil prices added to inflation worries, making a rate hike more likely. Selling picked up late in the week as speculators sold their holdings.
Technical Picture
Gold ended another week below the lower Bollinger Band, showing strong selling pressure. The 10-day moving average acted as resistance several times last week.
Outlook This Week
Gold looks oversold and could bounce, but buying remains risky. Prices are at one-year lows, and further sharp falls are possible. If buying for a short-term rebound, use a tight stop-loss.
Trade the news. No restrictions.
News trading is fully allowed at Fintokei. React to market-moving events your way.
Tuesday's U.S. midterm elections will be a key event this week, deciding which party controls the House and Senate. Friday brings the U.S. jobs report and consumer sentiment data, which could shape views on the economy. Australia and the UK are expected to raise interest rates by 0.25 percentage points, with traders watching for signs of more hikes. Manufacturing reports from around the world will also be in focus.

I make sure our support team is always there when traders need it. I trade too: sticking with a classic: EURUSD. I reset after both green and red days, either by keeping a steady breathing rhythm on a run or holding my breath over a historical novel in a café. Favorite platform: MetaTrader 5. Favorite challenge: SwiftTrader.