
Market Sector Scanner: Fed Minutes, Rate Expectations and Middle East Peace Talks
The FOMC minutes could shape expectations for an October Fed rate hike after weaker U.S. jobs data. USD/JPY faces resistance near 158 amid intervention concerns, while the Nasdaq tests its September highs and gold seeks support after a sharp decline. Middle East peace talks remain important for oil prices.

Friday's weaker U.S. jobs report led traders to reduce expectations of an October Fed rate hike, as nonfarm payrolls rose by just 29,000 versus 90,000 expected and wage growth disappointed. However, the dollar recovered its initial losses, while stronger-than-expected GDP growth helped keep long-term U.S. bond yields high. Rising borrowing costs weighed on U.S. equities and gold, which fell more than 3% to its lowest level since August. In Japan, Tokyo core inflation reached 2.7%, above the 2.4% forecast, adding to the case for further rate increases, although the BOJ's September meeting summary showed disagreement over how quickly to tighten policy.
Key Events Calendar
Jump to: Forex Market | Equities | Commodities
Market Outlook
Forex Market
USD/JPY
Last Week Recap
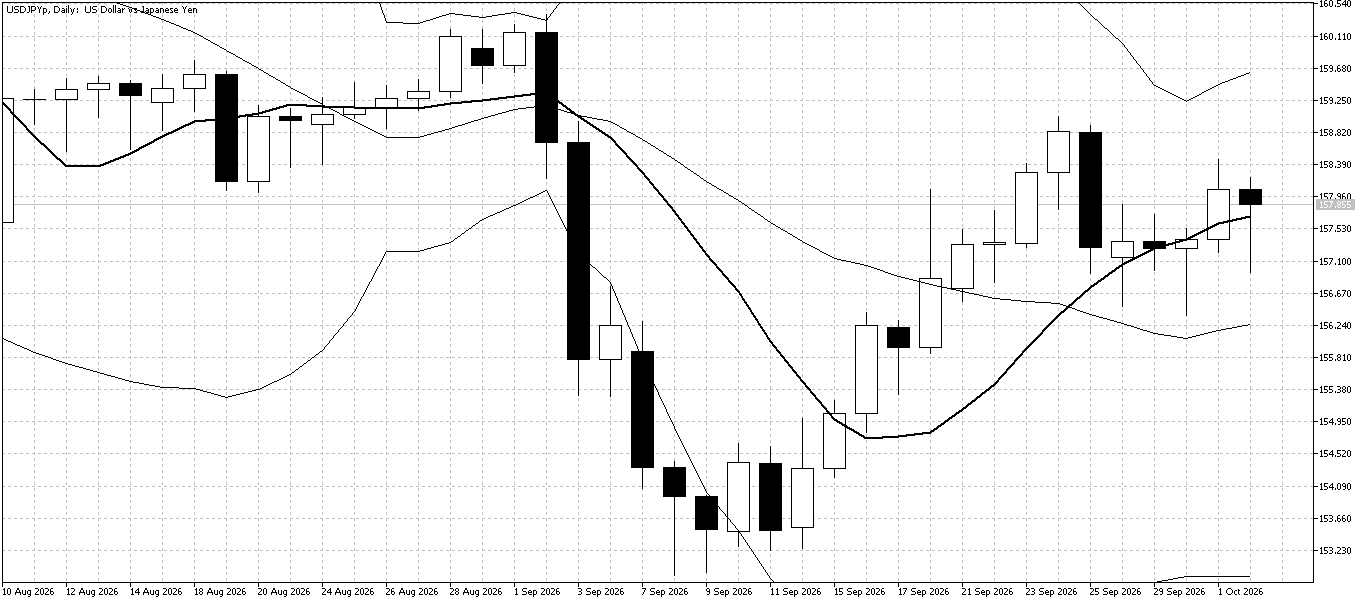
USD/JPY tested higher as markets refocused on the still-wide interest rate gap between the U.S. and Japan. However, the threat of intervention limited gains.
Technical Picture
The weekly close above the 10-day moving average confirmed the short-term uptrend, with prices trading near the middle of the Bollinger Bands.
Outlook This Week
A relatively quiet week with few major data releases could favour range trading. The 158 level remains an important resistance area to watch.
GBP/JPY
Last Week Recap
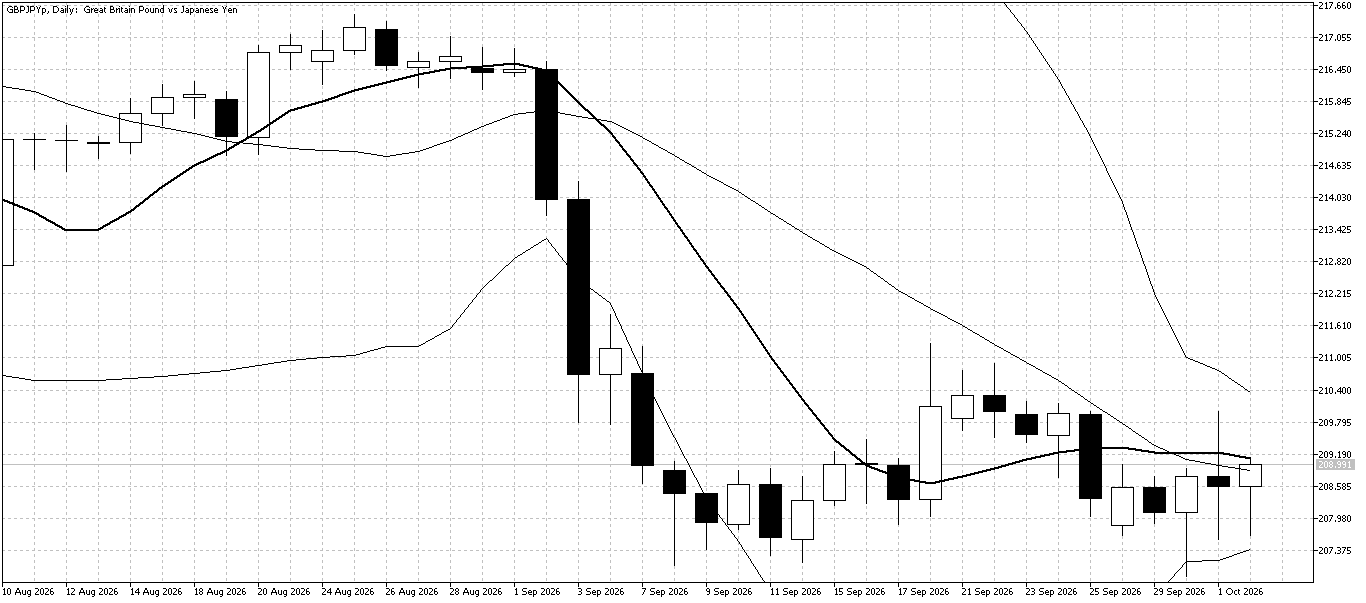
Growing expectations of a U.S. interest rate hike supported the dollar against both the pound and the yen, leaving GBP/JPY relatively quiet.
Technical Picture
GBP/JPY found support near the lower Bollinger Band and its September lows, which is encouraging. However, the flat 10-day moving average points to continued sideways movement.
Outlook This Week
The current technical picture and a light economic calendar favour range trading, with opportunities to buy near support and sell near resistance.
EUR/USD
Last Week Recap
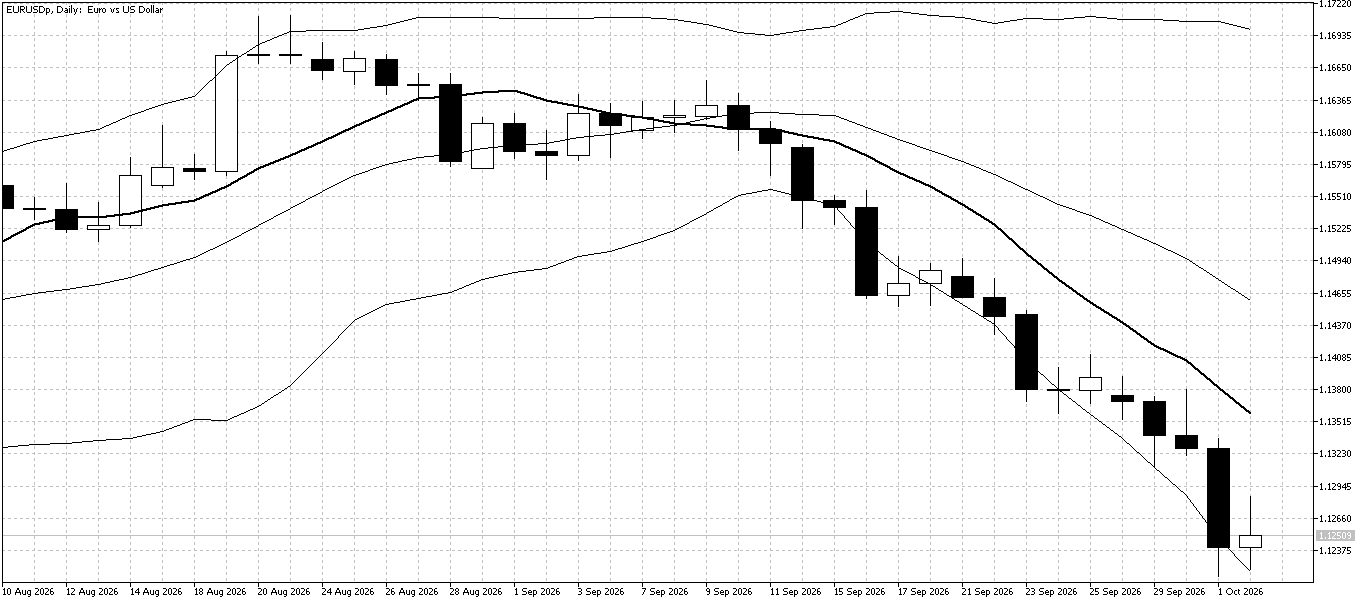
EUR/USD continued to fall as traders priced in higher U.S. interest rates, supporting the dollar and keeping the euro under pressure.
Technical Picture
The downtrend remains strong, with the pair repeatedly touching the lower Bollinger Band and the 10-day moving average sloping sharply downward.
Outlook This Week
Selling into strength remains the preferred approach. A rebound toward the 10-day moving average could offer a selling opportunity in line with the broader downtrend.
Equities
U.S. Stock Market
Last Week Recap
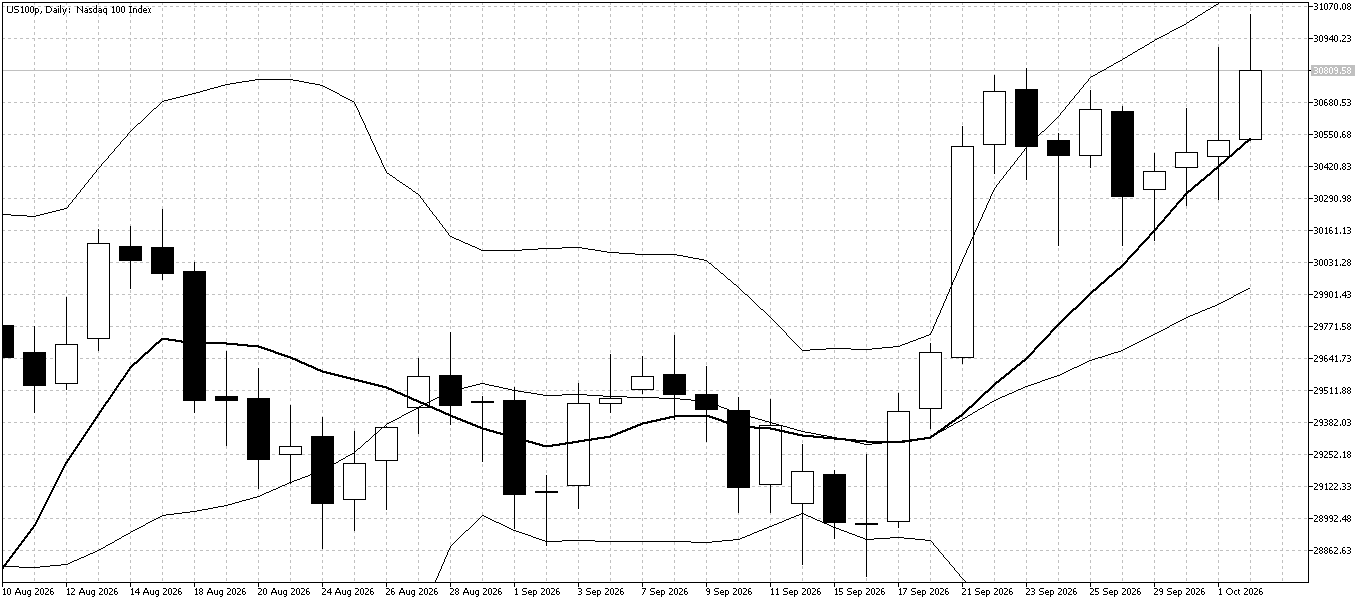
While the Dow Jones fell last week, the Nasdaq rose as investors showed renewed interest in AI-related stocks. Buying in technology shares helped the index move higher despite concerns about rising U.S. interest rates.
Technical Picture
The uptrend remains solid, with the 10-day moving average providing support several times last week. Buyers returned when prices dipped toward this line, although the September highs remain a potential barrier to further gains.
Outlook This Week
The Nasdaq could face resistance near the September highs, leading to a period of range trading. Buying on dips toward the 10-day moving average and selling near resistance may offer opportunities while these levels hold. A clear break above the September highs could open the way for further gains.
Commodities
Gold
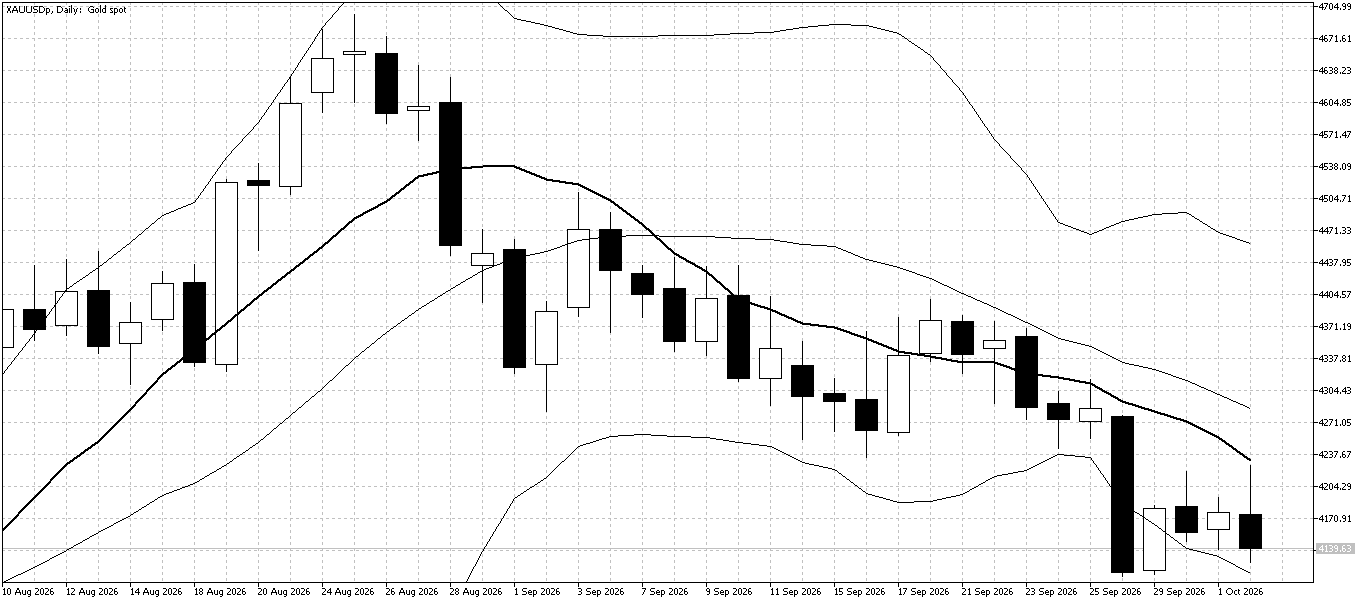
Last Week Recap
Gold fell sharply last week as rising U.S. interest rate expectations prompted aggressive speculative selling, pushing prices below the September lows. Even weaker-than-expected U.S. payroll data brought only a temporary rebound before selling resumed.
Technical Picture
The lower Bollinger Band is providing short-term support, but the downward-sloping 10-day moving average continues to weigh on prices. Gold has settled into a narrow range, suggesting another large fall may be less likely in the near term.
Outlook This Week
Waiting for a rebound toward the 10-day moving average could offer a selling opportunity in line with the downtrend. Alternatively, buying near last week's lows with a tight stop-loss may offer a short-term opportunity if support holds.
Trade the news. No restrictions.
News trading is fully allowed at Fintokei. React to market-moving events your way.
Markets will watch peace talks in the Middle East this week, as any progress could affect WTI oil prices, which remain below $100 a barrel. With few major economic reports due, the FOMC meeting minutes may give traders clues about whether the Fed will raise interest rates again in October.

I make sure our support team is always there when traders need it. I trade too: sticking with a classic: EURUSD. I reset after both green and red days, either by keeping a steady breathing rhythm on a run or holding my breath over a historical novel in a café. Favorite platform: MetaTrader 5. Favorite challenge: SwiftTrader.