


Market Sector Scanner: U.S. CPI, Middle East Tensions & Stock Market Recovery
Markets remain volatile following the U.S. midterm elections and strong employment data. This week, attention turns to U.S. CPI and developments in the Middle East, with inflation expectations, potential Fed rate hikes, stock market recovery, and further pressure on oil prices in focus.

Global stock markets had a volatile week following the U.S. midterm elections. Stocks initially rose after Democrats won control of Congress but fell sharply as investors worried about AI spending and future profits. U.S. employment was stronger than expected, with 165,000 new jobs compared with forecasts of 65,000. However, U.S. bond yields fell as investors moved toward safer investments, helping gold recover toward $4,000. Oil prices dropped more than 10% as pressure grew to end the war with Iran and lower living costs. The Bank of England raised interest rates to 4.0%, while Japan's Nikkei 225 fell sharply as AI-related stocks continued to lose value.
Key Events Calendar
Jump to: Forex Market | Equities | Commodities
Market Outlook
Forex Market
USD/JPY
Last Week Recap
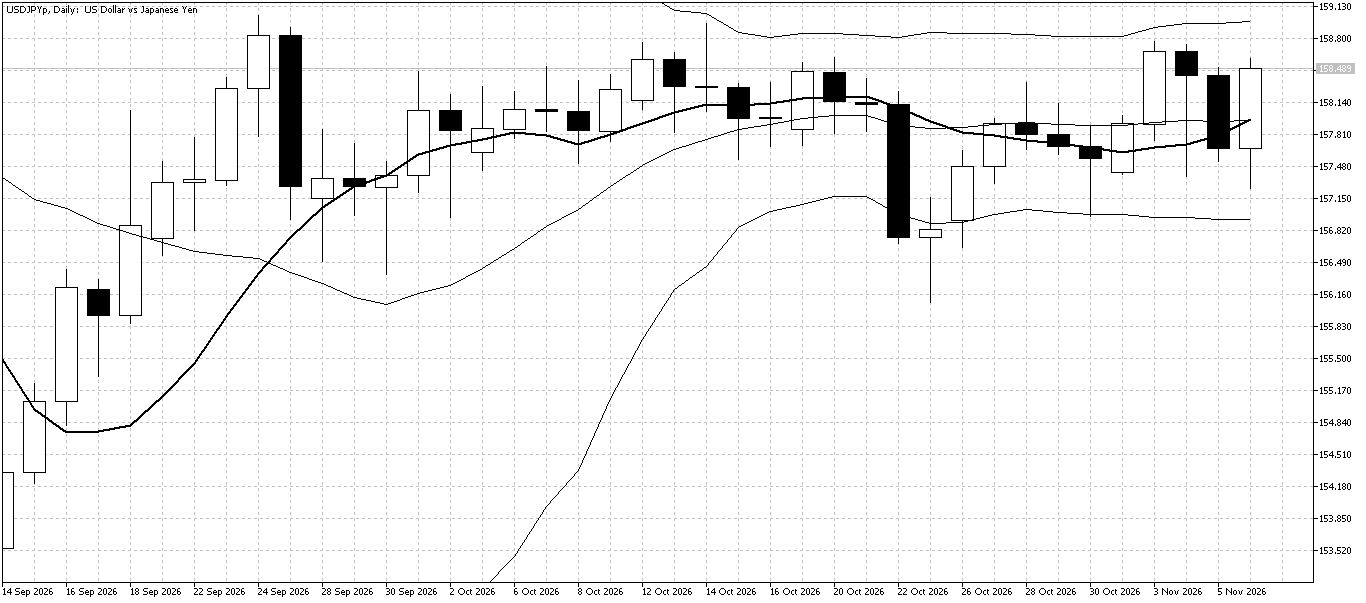
USD/JPY continued to trade around 158 as market attention shifted to large moves in equities. Strong U.S. employment data helped the pair finish the week near its highs.
Technical Picture
The Bollinger Bands suggest the market remains range-bound, but the 10-day moving average is starting to turn higher, pointing to a possible test of 159 in the short term.
Outlook This Week
While USD/JPY looks likely to test higher levels, the threat of Japanese authorities intervening to support the yen remains. Waiting for a pullback closer to 158 before buying looks like the better strategy this week.
GBP/JPY
Last Week Recap
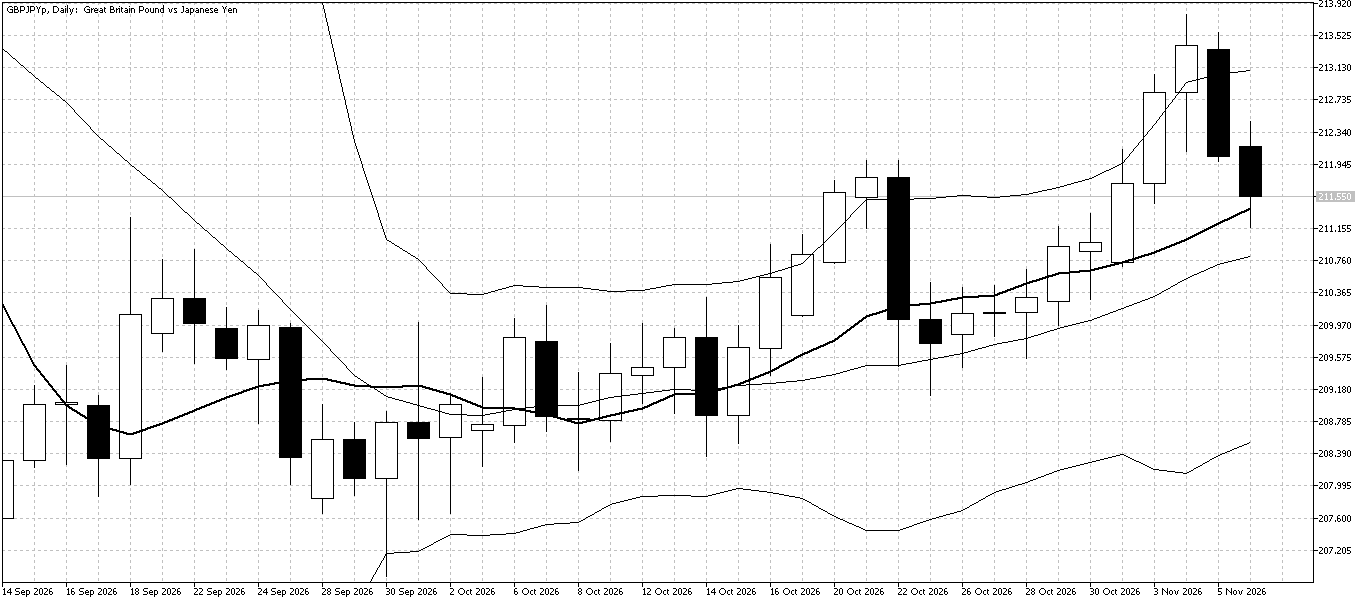
GBP/JPY rose ahead of the Bank of England's expected interest rate hike. However, once the increase was confirmed, sellers returned. Strong U.S. employment data added further pressure, pushing GBP/JPY lower.
Technical Picture
The upper Bollinger Band provided a selling opportunity last week, with prices quickly falling back towards the 10-day moving average. The moving average continues to point higher and is now acting as support.
Outlook This Week
GBP/JPY remains in an uptrend despite last week's decline. As long as prices stay above the 10-day moving average, buying on pullbacks remains the preferred strategy.
EUR/USD
Last Week Recap
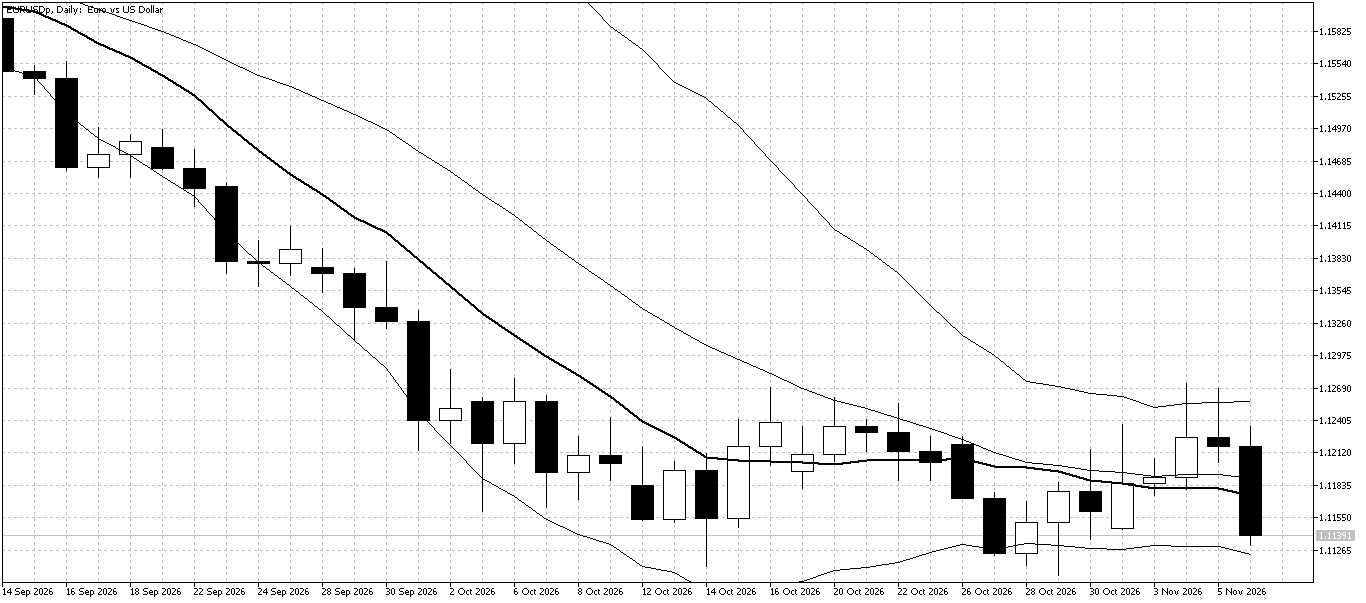
EUR/USD recovered gradually for much of last week as U.S. long-term bond yields fell following the midterm elections. However, stronger-than-expected U.S. employment data supported the dollar, pushing EUR/USD lower towards the end of the week.
Technical Picture
The Bollinger Bands remain narrow, suggesting the market is still trading in a range. The upper band acted as resistance last week, while the flat 10-day moving average shows a lack of clear direction.
Outlook This Week
Despite the recent range trading, EUR/USD remains under pressure. Selling rallies towards the upper Bollinger Band looks like the better strategy this week.
Equities
U.S. Stock Market
Last Week Recap
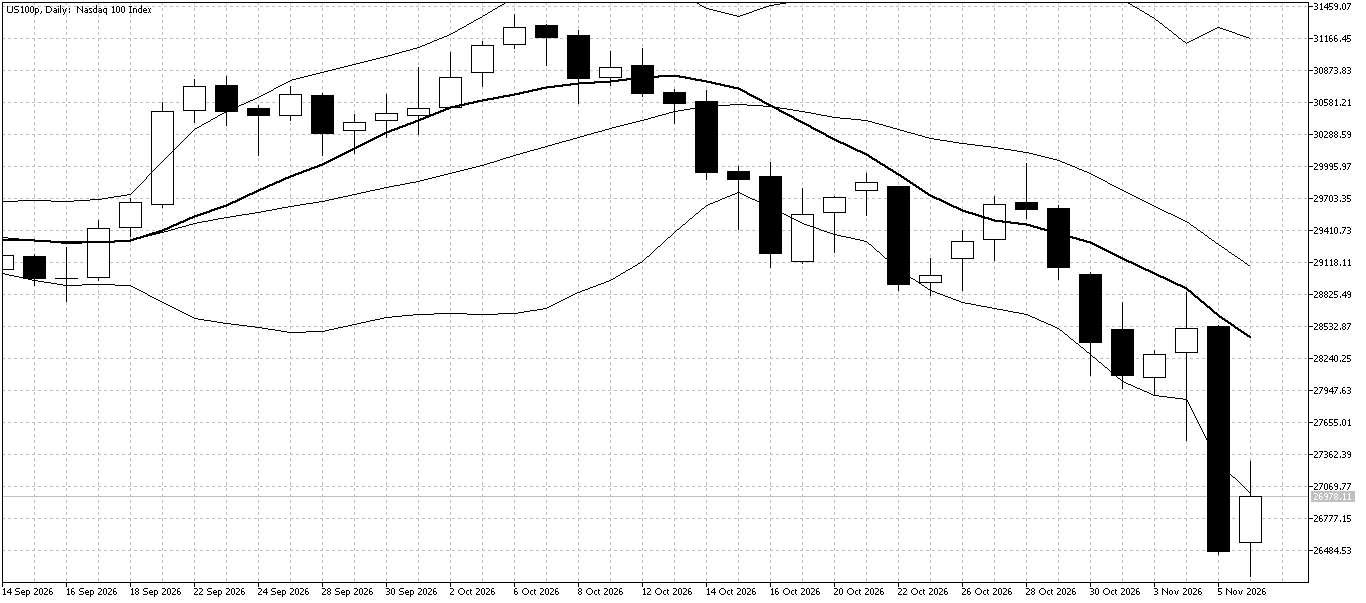
Technology stocks suffered another week of losses as investors worried that Democratic policies could slow the growth of data centres and AI investment. These concerns triggered heavy selling in AI-related stocks, pushing the Nasdaq sharply lower.
Technical Picture
The downtrend remains strong, with the Nasdaq closing the week below the lower Bollinger Band. This suggests selling pressure is intense, but the market may now be oversold in the short term.
Outlook This Week
The oversold market could create buying opportunities for short-term traders early in the week. However, the broader downtrend remains intact, so medium-term traders may be better off waiting for a rebound to higher levels before selling.
Curious what's inside?
Create a free account and explore the Fintokei zone — loyalty rewards, dashboards, refer a friend and more. No challenge required.
Commodities
Gold
Last Week Recap
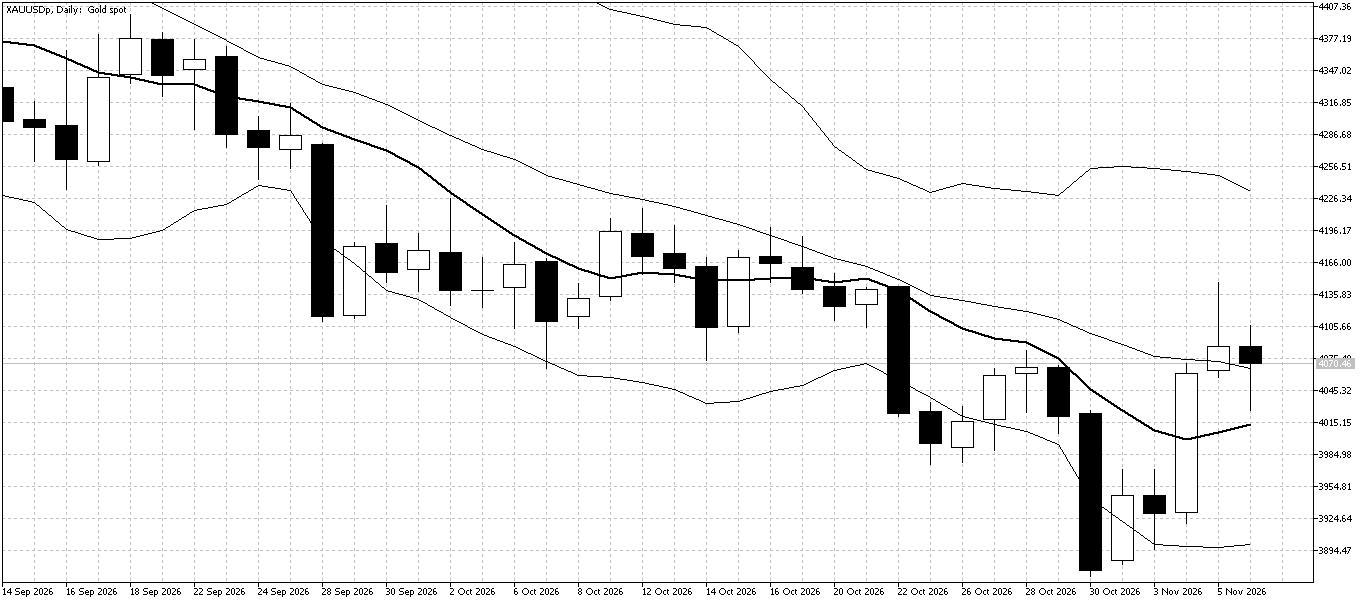
Gold rose strongly last week, recovering above $4,000 as long-term U.S. bond yields fell following the midterm elections. Lower bond yields made gold more attractive to investors, supporting the recovery.
Technical Picture
The lower Bollinger Band provided a buying opportunity last week, with prices rebounding strongly. Gold has now moved above the 10-day moving average, suggesting market sentiment is turning more positive.
Outlook This Week
After several months of selling pressure, gold looks ready for further gains. Buying pullbacks while prices remain above $4,000 looks like the preferred strategy this week.
Trade the news. No restrictions.
News trading is fully allowed at Fintokei. React to market-moving events your way.
Oil prices could face another volatile week as the U.S. works to reach an agreement to end the conflict in the Middle East. Any progress in negotiations could put further pressure on WTI crude oil prices. Meanwhile, the main economic event will be U.S. inflation data, with markets now expecting the Federal Reserve to increase interest rates at its next meeting. Weaker-than-expected inflation could reduce the chances of a rate hike and support stocks while putting pressure on the U.S. dollar.

I make sure our support team is always there when traders need it. I trade too: sticking with a classic: EURUSD. I reset after both green and red days, either by keeping a steady breathing rhythm on a run or holding my breath over a historical novel in a café. Favorite platform: MetaTrader 5. Favorite challenge: SwiftTrader.