
Market Sector Scanner: AI Stock Sell-Off and Oil Near $100
Rising oil prices and stronger-than-expected U.S. inflation fuel concerns about higher borrowing costs and pressure on AI stocks. Markets watch for further selling, while gold remains supported.

AI worries hit stock markets last week, sending the Nasdaq 100 down over 4% and Japan's Nikkei down more than 5%. The Dow rose as investors favored established companies. U.S. CPI and PPI were both higher than forecast, but expectations for a Fed rate hike barely changed, and the dollar was little changed against the yen. Oil reached around $100 as attacks near the Strait of Hormuz increased and fears of further U.S. strikes on Iran grew.
Key Events Calendar
Jump to: Forex Market | Equities | Commodities
Market Outlook
Forex Market
USD/JPY
Last Week Recap
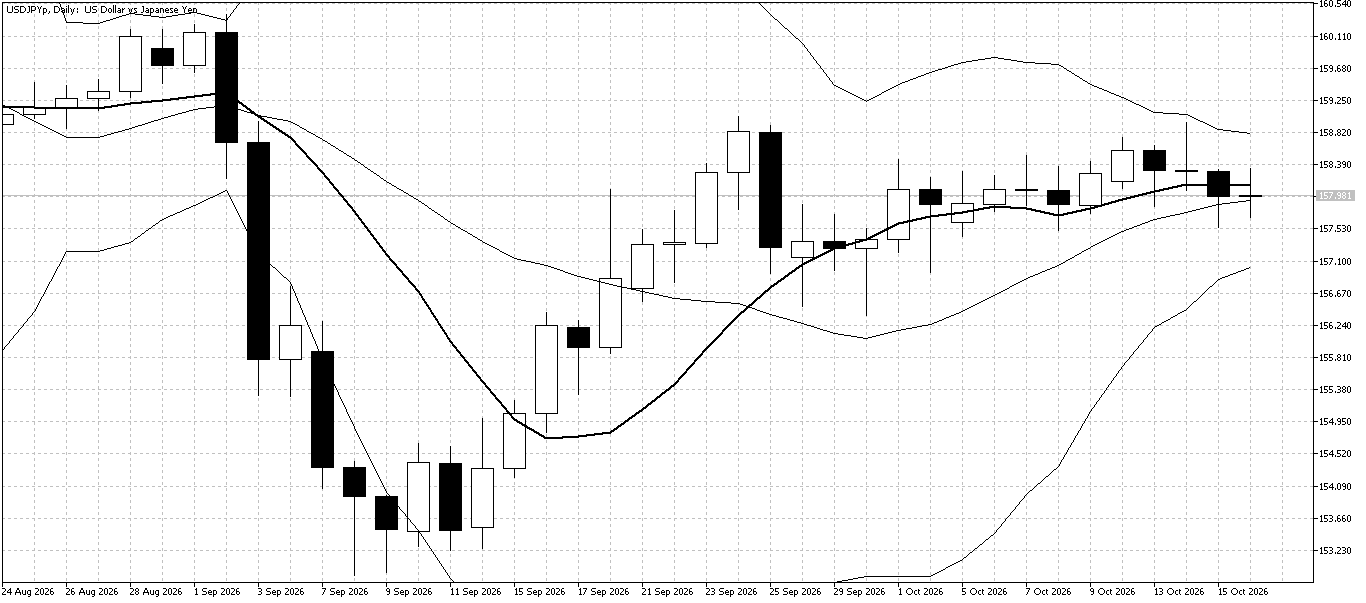
USD/JPY tested higher after U.S. inflation came in above expectations, but returned to around 158 as the dollar weakened late in the week amid a sell-off in AI-related stocks.
Technical Picture
The 10-day moving average has flattened following last week's price action, while the Bollinger Bands continue to narrow as volatility falls.
Outlook This Week
USD/JPY looks likely to trade sideways in the short term, though the rejection at resistance suggests it could test lower levels.
GBP/JPY
Last Week Recap
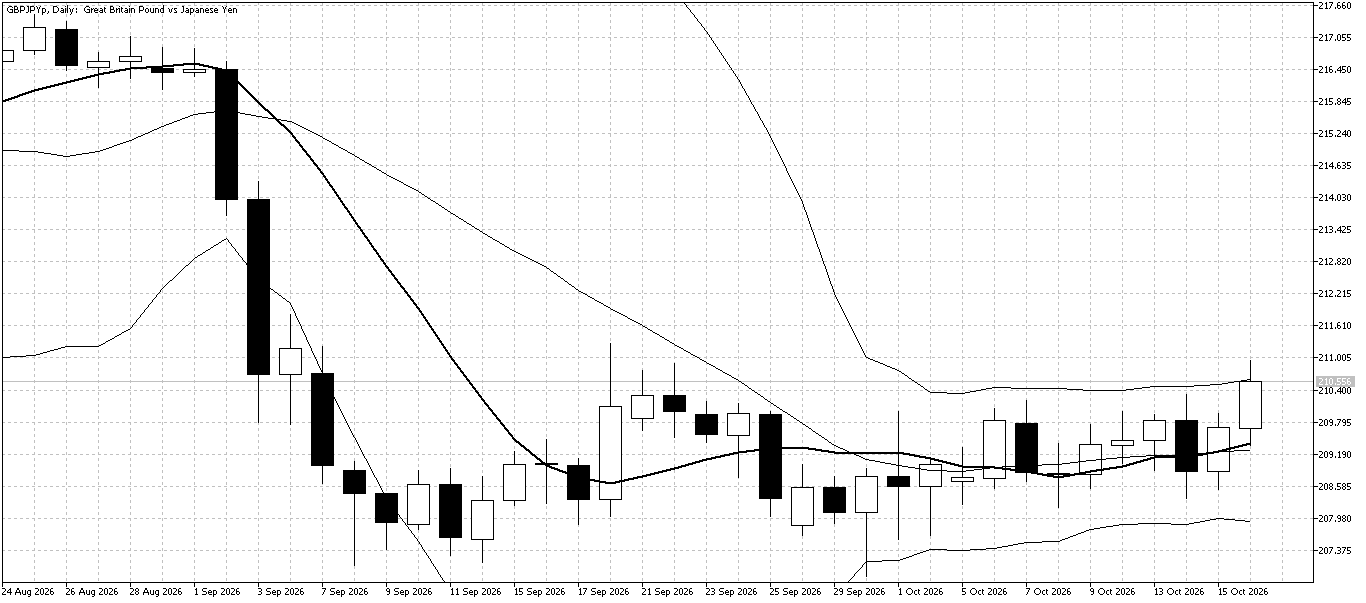
GBP/JPY finished the week higher after better-than-expected U.K. GDP data, though trading remained quiet overall.
Technical Picture
GBP/JPY closed near the upper Bollinger Band as the 10-day moving average began to turn higher. The bands remain narrow, but this could signal the start of a pickup in volatility.
Outlook This Week
The short-term outlook is improving, but range trading is likely to continue with few major data releases this week. Medium-term traders could look for opportunities to buy on pullbacks.
EUR/USD
Last Week Recap
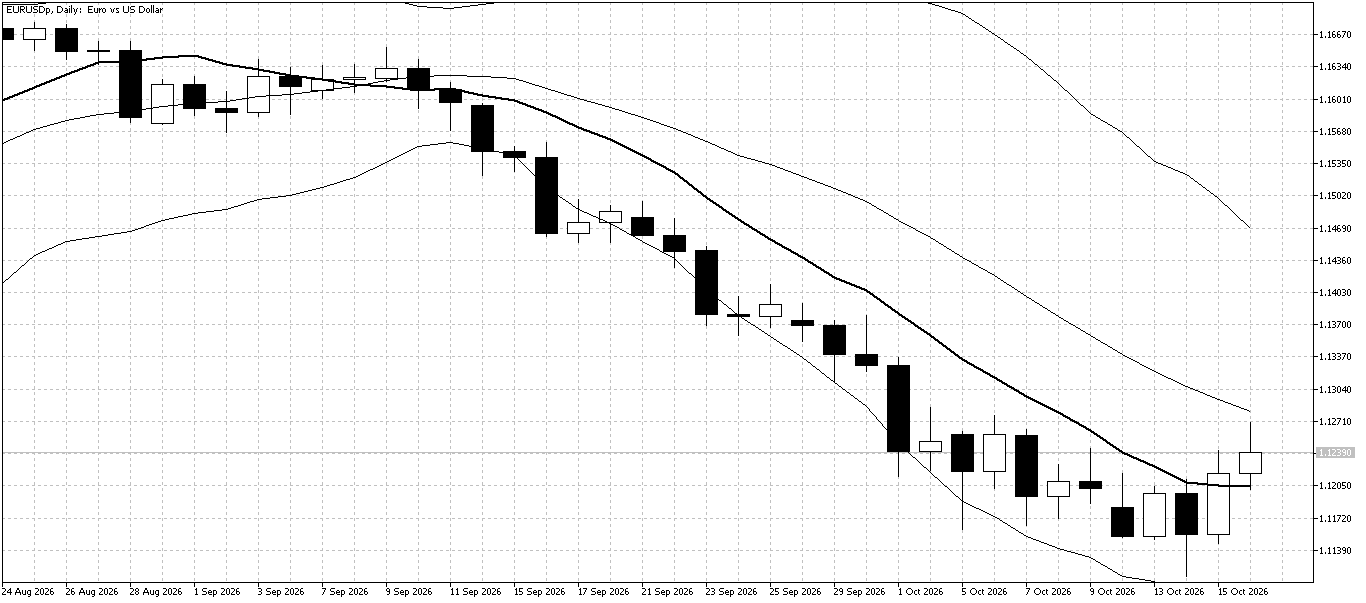
EUR/USD tested recent lows after U.S. inflation came in above expectations, but support held as markets still viewed a rate increase at the next Fed meeting as unlikely. Stronger-than-expected eurozone inflation then helped the pair finish the week strongly.
Technical Picture
The downtrend that began in September appears to have ended after EUR/USD closed above the 10-day moving average, which has now flattened. However, resistance at the upper Bollinger Band could limit further gains in the short term.
Outlook This Week
Last week's shift in sentiment suggests buying on pullbacks could be the better approach. With the upper Bollinger Band acting as resistance, patience in waiting for an entry looks important.
Equities
U.S. Stock Market
Last Week Recap
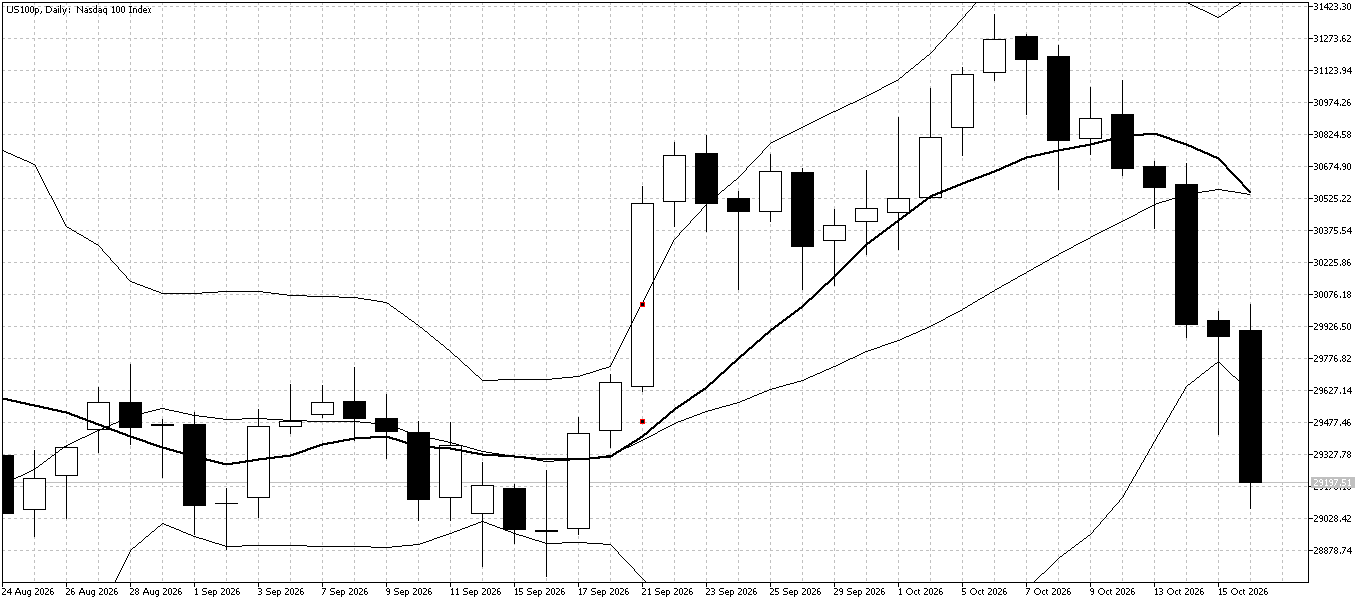
The Nasdaq fell sharply last week as investors worried that rising borrowing costs could weigh on AI-related stocks, following record highs earlier in the month.
Technical Picture
The sharp sell-off left the Nasdaq looking heavily oversold in the short term, with prices closing well below the lower Bollinger Band and far beneath the 10-day moving average.
Outlook This Week
Despite oversold conditions, short-term traders should wait for signs of stability before buying. Tight stop-losses remain important, as the Nasdaq's volatility leaves it vulnerable to another sell-off.
Curious what's inside?
Create a free account and explore the Fintokei zone — loyalty rewards, dashboards, refer a friend and more. No challenge required.
Commodities
Gold
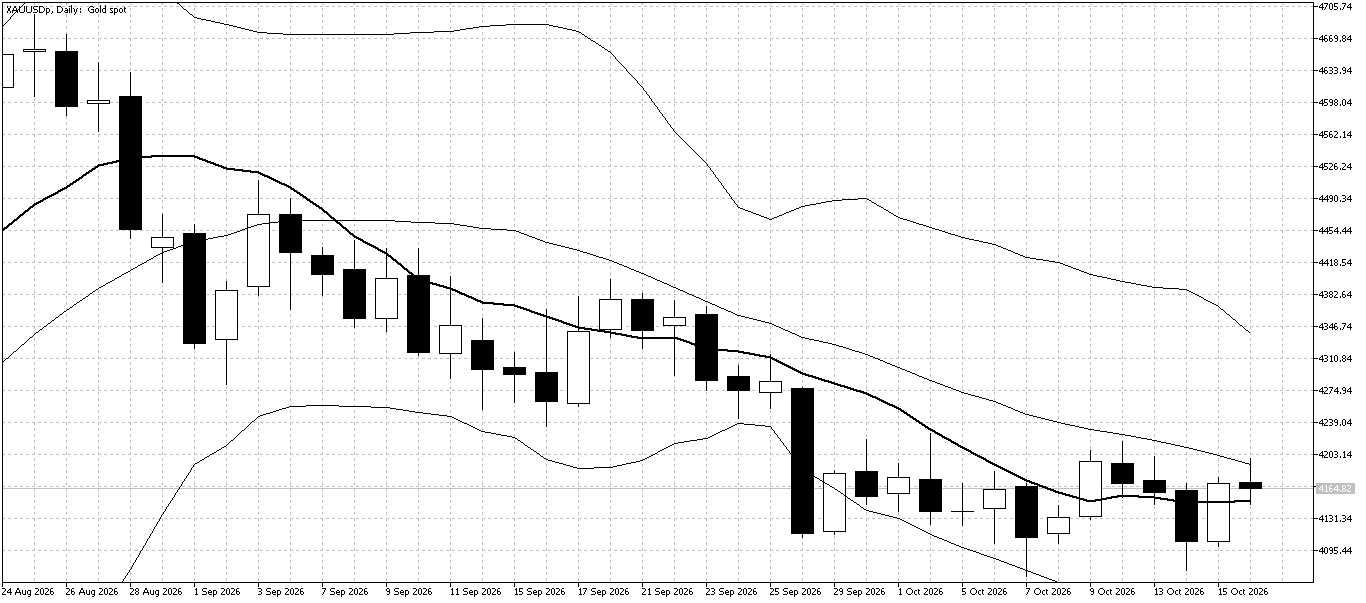
Last Week Recap
Gold came under pressure midweek after U.S. inflation exceeded expectations, but support held as markets did not increase expectations for a rate hike at the next Fed meeting. Demand from long-term buyers also continued to support prices.
Technical Picture
Sideways to higher price action remains the most likely outlook, with the 10-day moving average flat and recent lows providing support.
Outlook This Week
Range trading still looks suitable for short-term traders. Medium- to long-term traders could prepare for a possible move higher if weaker-than-expected U.S. data triggers renewed buying.
Trade the news. No restrictions.
News trading is fully allowed at Fintokei. React to market-moving events your way.
AI stocks will be closely watched this week after last week's sharp falls. If selling continues, investors could become more cautious and pull money out of other markets. With no major economic data due until Friday, oil prices and U.S. inflation concerns are also likely to guide trading. A further rise in WTI crude could increase worries about inflation and the chance of higher U.S. interest rates.

I make sure our support team is always there when traders need it. I trade too: sticking with a classic: EURUSD. I reset after both green and red days, either by keeping a steady breathing rhythm on a run or holding my breath over a historical novel in a café. Favorite platform: MetaTrader 5. Favorite challenge: SwiftTrader.