Market Sector Scanner: Trade War Shocks Markets as Trump Imposes 100% Tariffs on China
Global markets tumbled after Trump reignited the trade war with China, sending gold above $4,000 and risk assets lower. The yen weakened after Takaichi’s LDP win, while traders now await key U.S. inflation data for clues on the Fed’s next move.

Global markets swung sharply after Donald Trump reignited the trade war with China, announcing a 100% tariff on all Chinese imports from November 1, 2025. The move, responding to China’s rare earth export limits, sparked a sell-off in risk assets. Gold jumped above $4,000 on safe-haven demand, while the yen weakened after Sanae Takaichi won Japan’s ruling party vote. In the U.S., the Fed signaled more 2025 rate cuts, but Chair Powell said inflation must cool further as the shutdown delays key data.
Scan for opportunities on:
Key Events Calendar for October 13 – 17
Market Sector Scanner
Forex Market
USD/JPY
Last Week Recap
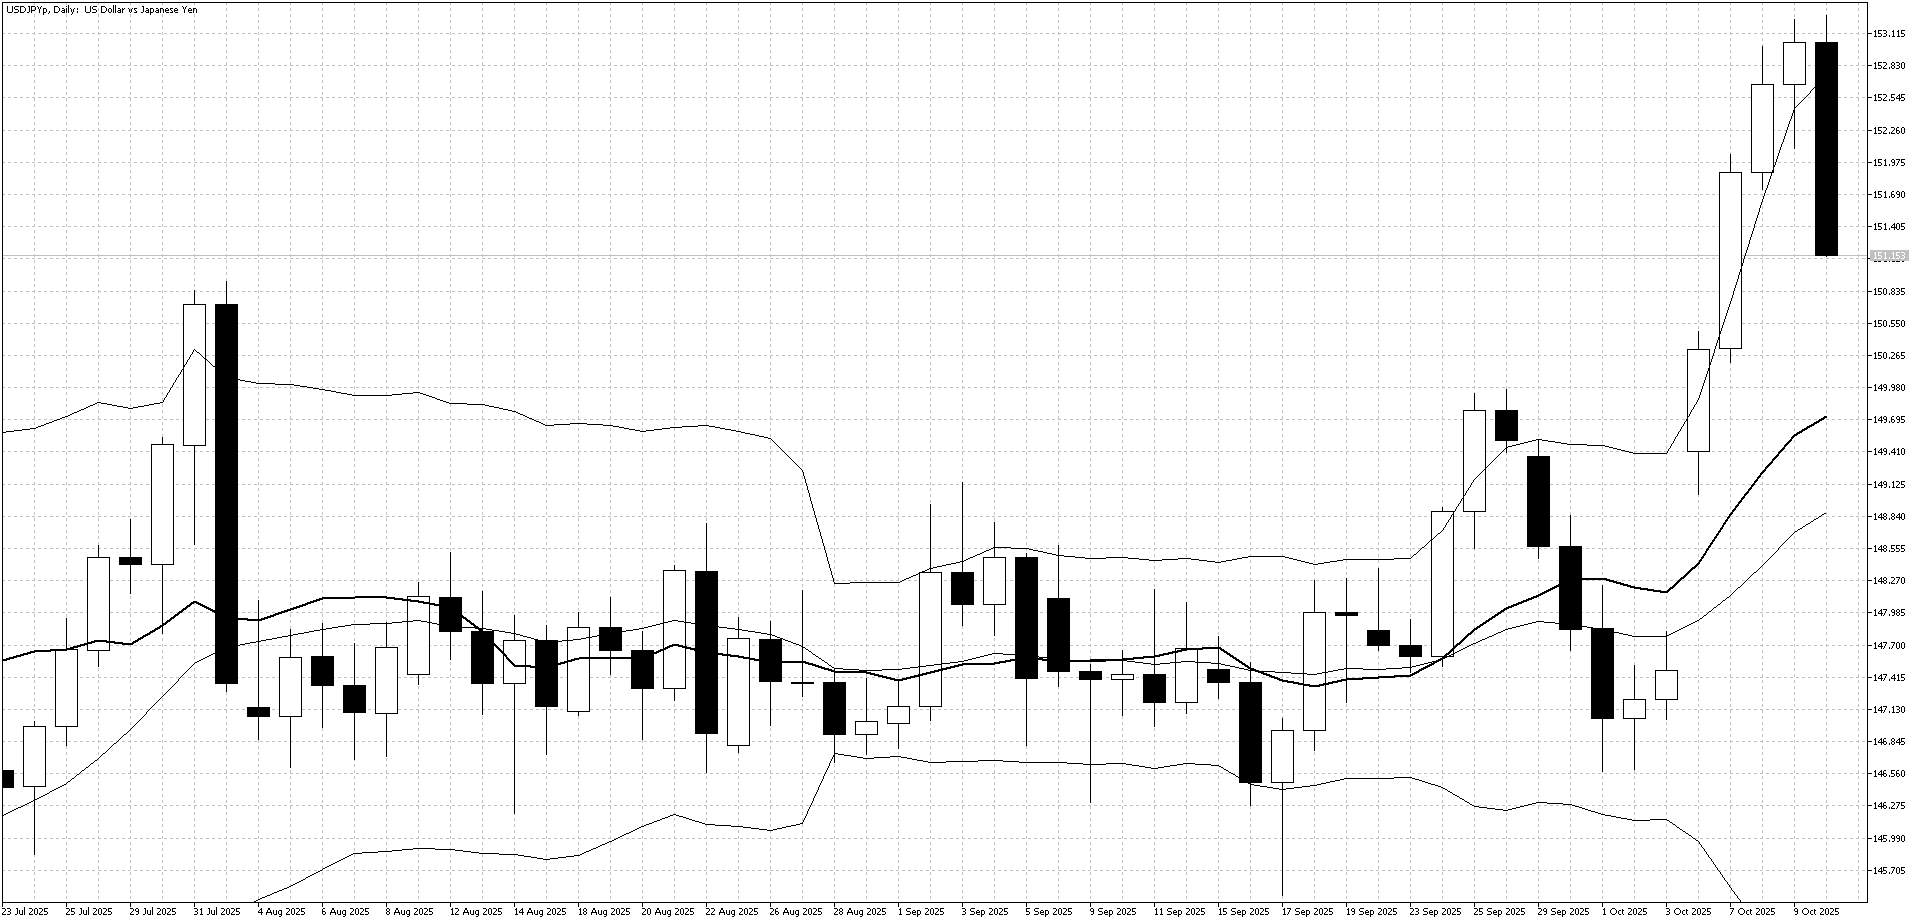
The USD/JPY surged higher last week after Sanae Takaichi won the LDP leadership, reducing expectations for near-term rate hikes in Japan. The rapid yen weakness raised concerns among officials about volatility. A brief sell-off on Friday’s renewed U.S.–China trade tensions failed to change the overall trend, and the pair still ended the week with strong gains.
Technical Picture
The upper Bollinger Band triggered a sell signal on Friday, and with a large gap remaining to the 10-day moving average, the risk of a short-term pullback remains high, suggesting lower levels are possible in the near term.
Outlook This Week
A volatile week lies ahead, with uncertainty over whether Takaichi will become prime minister and ongoing U.S.–China trade tensions. The USD/JPY may test support near 150, with resistance seen around 152 as traders react to political and geopolitical developments.
GBP/JPY
Last Week Recap
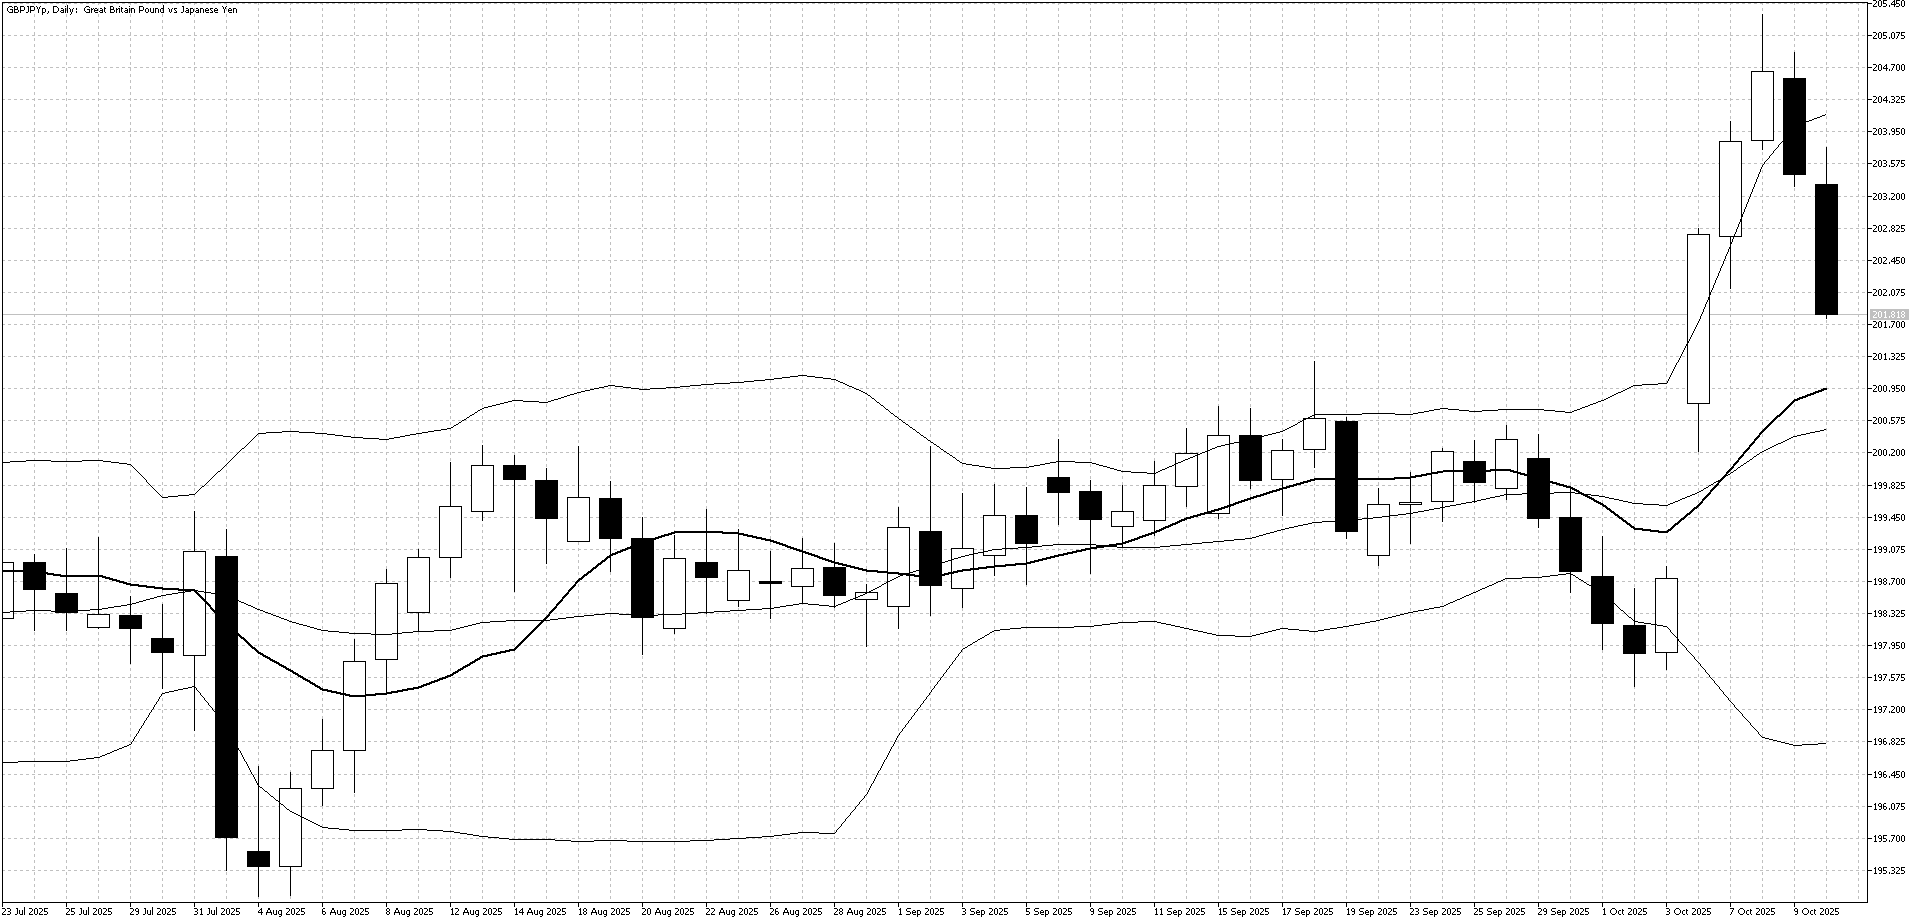
GBP/JPY hit new highs for 2025 as yen weakness pushed the pair easily above the 200 level. However, the market turned lower toward the end of the week as risk-off sentiment increased following new U.S. tariffs on Chinese goods.
Technical Picture
The upper Bollinger Band acted as strong resistance late last week, and the market now looks likely to test the 10-day moving average, which could provide near-term support.Outlook This Week
A volatile week is expected as traders focus on developments in Japanese politics and U.S.–China trade headlines. Range trading is likely the best strategy this week as the market consolidates the recent gains.
EUR/USD
Last Week Recap
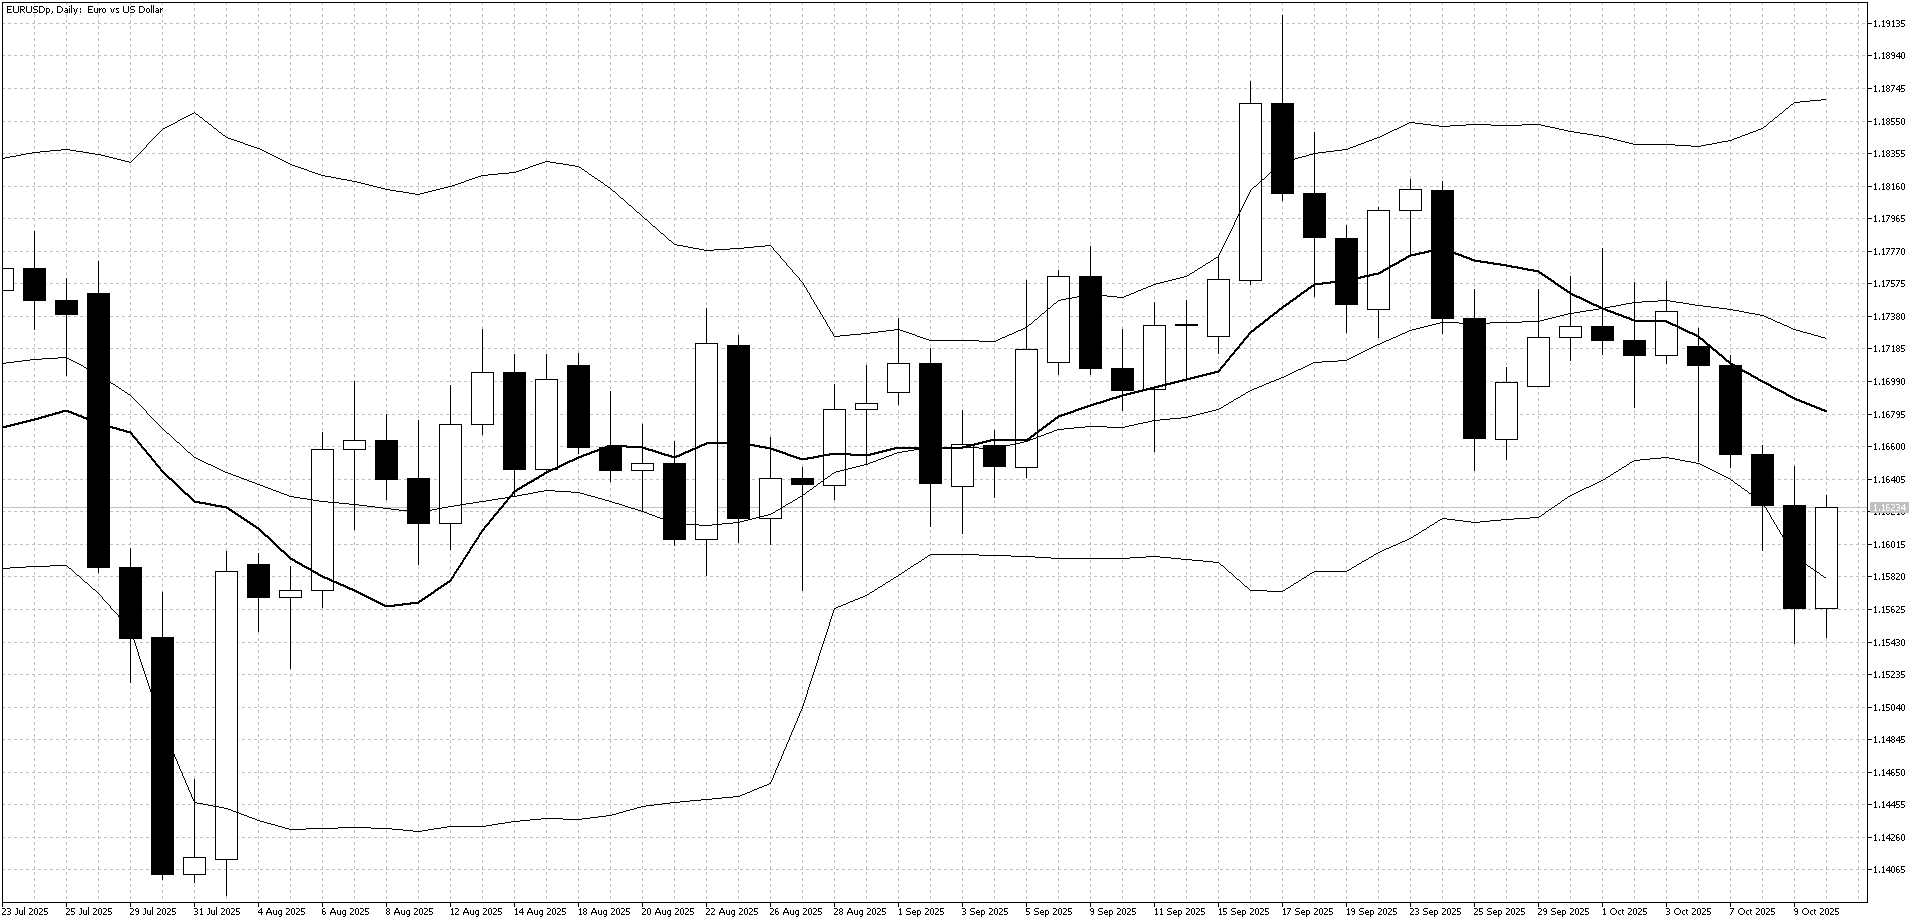
Weaker-than-expected European economic data and renewed strength in the U.S. dollar pushed EUR/USD lower for the week, as traders grew increasingly concerned about the outlook for the European economy.
Technical Picture
The 10-day moving average is trending lower, suggesting a short-term downtrend, but the lower Bollinger Band has provided support and triggered some buying interest toward the end of last week.
Outlook This Week
While further losses appear likely in the medium term, the market remains just above key support at 1.1600. It may be better to wait and sell into strength this week rather than chase the downside.
FREE EBOOK: How to start with prop trading
Discover the secret to the discipline that turns everyday people into well-paid pro traders. Learn how prop trading works – and how you can start your own journey.
Equities
U.S. Stock
Last Week Recap
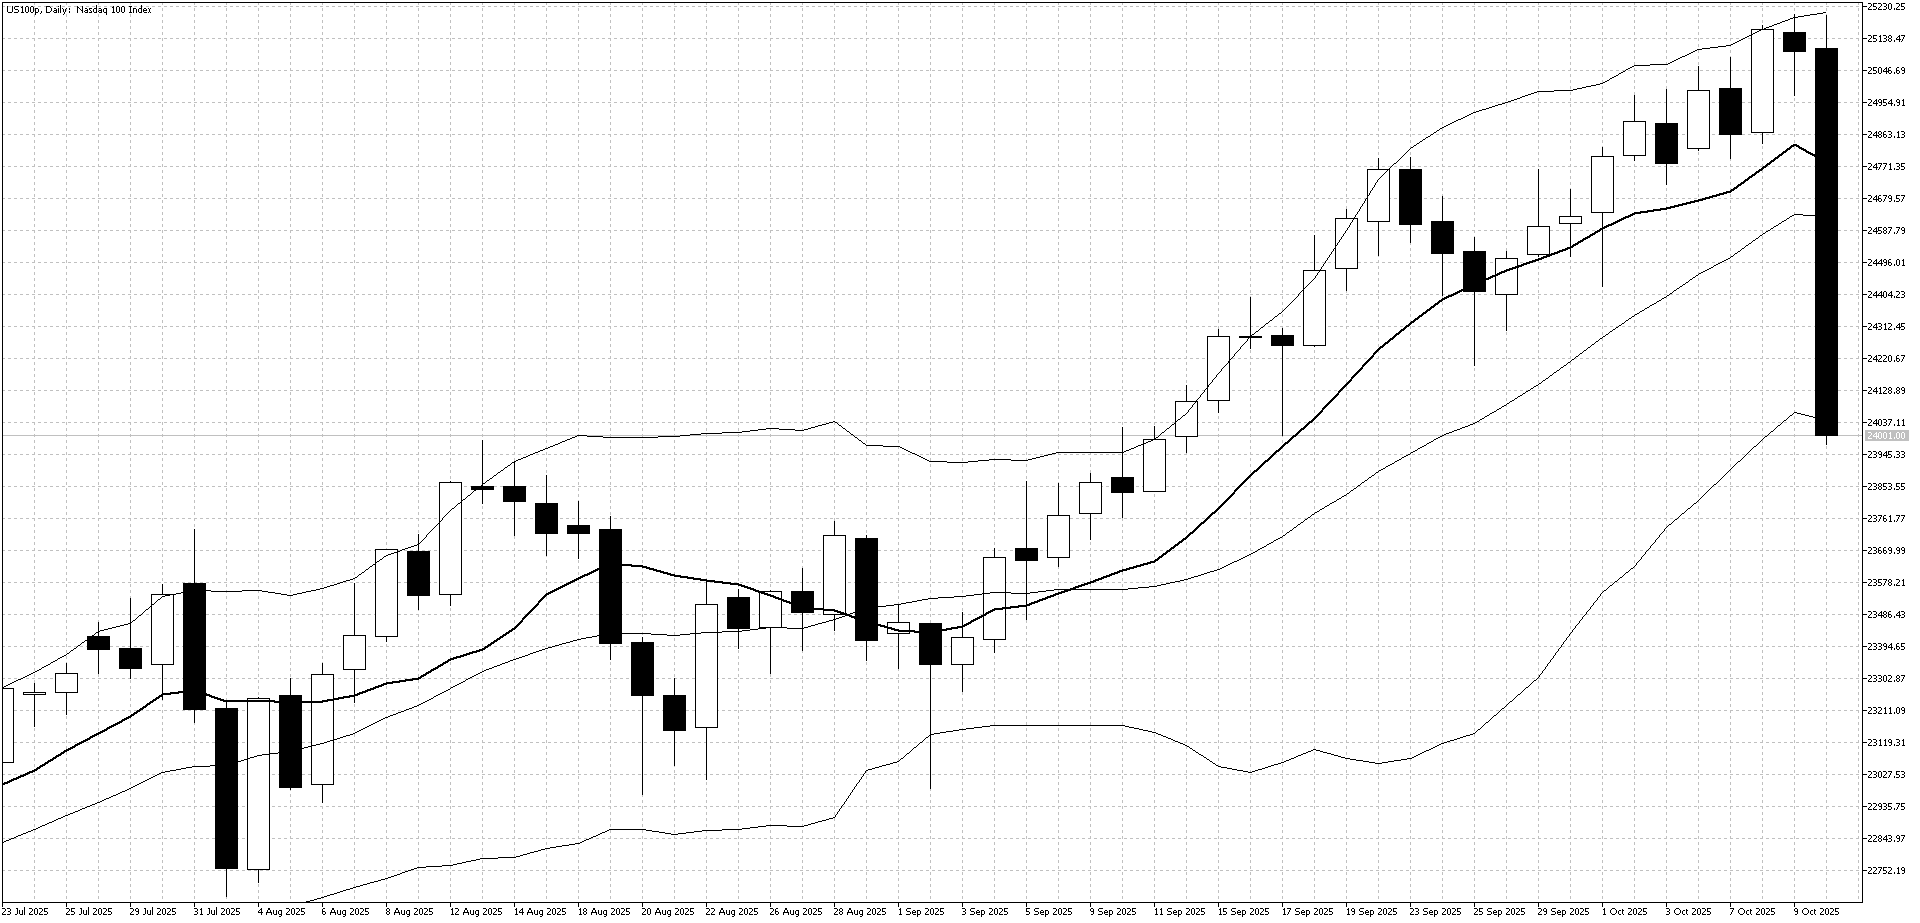
The Nasdaq saw a sharp reversal on Friday, falling nearly 4% after hitting record highs the previous day on AI optimism. Sentiment turned negative after Trump announced 100% tariffs on Chinese goods following China’s export restrictions on rare earth materials, leading to heavy selling in the technology sector.
Technical Picture
The 10-day moving average has not yet turned bearish, and the lower Bollinger Band is expected to offer support this week as volatility stays high.
Outlook
The market looks oversold in the short term, and since Trump often resolves trade disputes quickly, a rebound early in the week is likely. However, if U.S.–China tensions rise further, more losses are possible.
Commodities
Gold
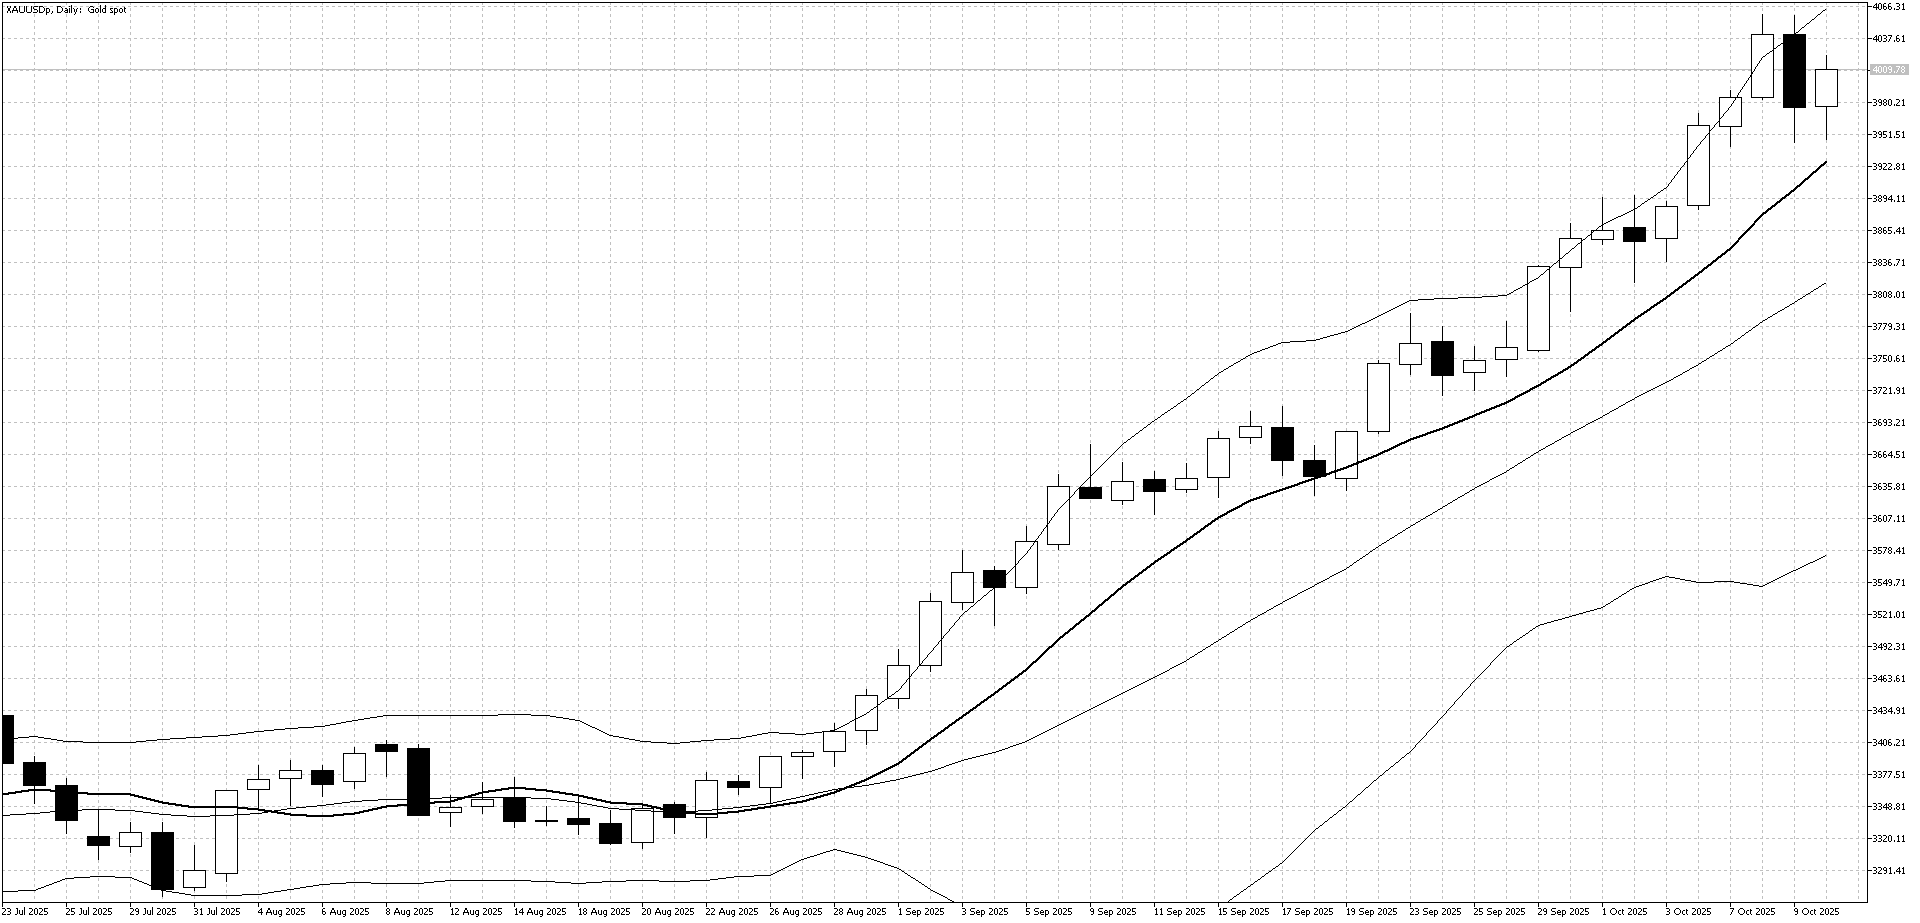
Last Week Recap
Gold climbed above $4,000 as investors continued to buy it as an alternative to holding U.S. dollars. After some profit-taking above that level, Trump’s announcement of new tariffs on China reignited demand and pushed prices back above $4,000 again.
Technical Picture
The uptrend remains strong with the 10-day moving average still pointing higher. However, the upper Bollinger Band continues to act as resistance and recently triggered a sell signal, suggesting that sellers may step in again if prices move above $4,000.
Outlook This Week
Gold remains in strong demand as concerns about global trade disruptions persist and investors reduce U.S. dollar holdings. However, prices have already risen sharply, and profit-taking could occur if trade negotiations show progress. A break below the 10-day moving average would signal weakness, so short-term traders may look for selling opportunities this week.
This week’s focus will be on key U.S. data, including inflation and retail sales, which could shape expectations for the next Fed rate cut and drive market volatility. Investors are also watching China’s reaction to trade tensions and whether Donald Trump can reach a deal or trigger a full trade war. In Japan, the ruling party’s search for coalition partners will keep politics in the spotlight.
