Market Sector Scanner – Oil Drops on Ceasefire, Stocks Rally as Markets Eye Powell and Tariff Deadline
Stock markets rallied last week as a Middle East ceasefire drove oil prices sharply lower. Weak U.S. data pressured the dollar, while hopes for U.S. rate cuts lifted equities. All eyes now turn to Powell’s speech and the July 8–9 tariff deadline.

A ceasefire between Israel and Iran calmed markets last week, sending oil prices down more than 10% early in the week. Global stock markets rose as investors grew more confident, hoping for lower interest rates and less risk from the Middle East. Both U.S. GDP growth and durable goods orders came in below forecasts, and former President Trump continued to pressure the Fed to cut rates. The Fed left rates unchanged at 4.25%–4.5% but said it might lower them later this year. The U.S. dollar weakened on the soft data, and gold fell as safe-haven demand dropped.
Scan for opportunities on:
Key Events Calendar for June 30 – July 4
Market Sector Scanner
Forex Market
USD/JPY
Last Week Recap:
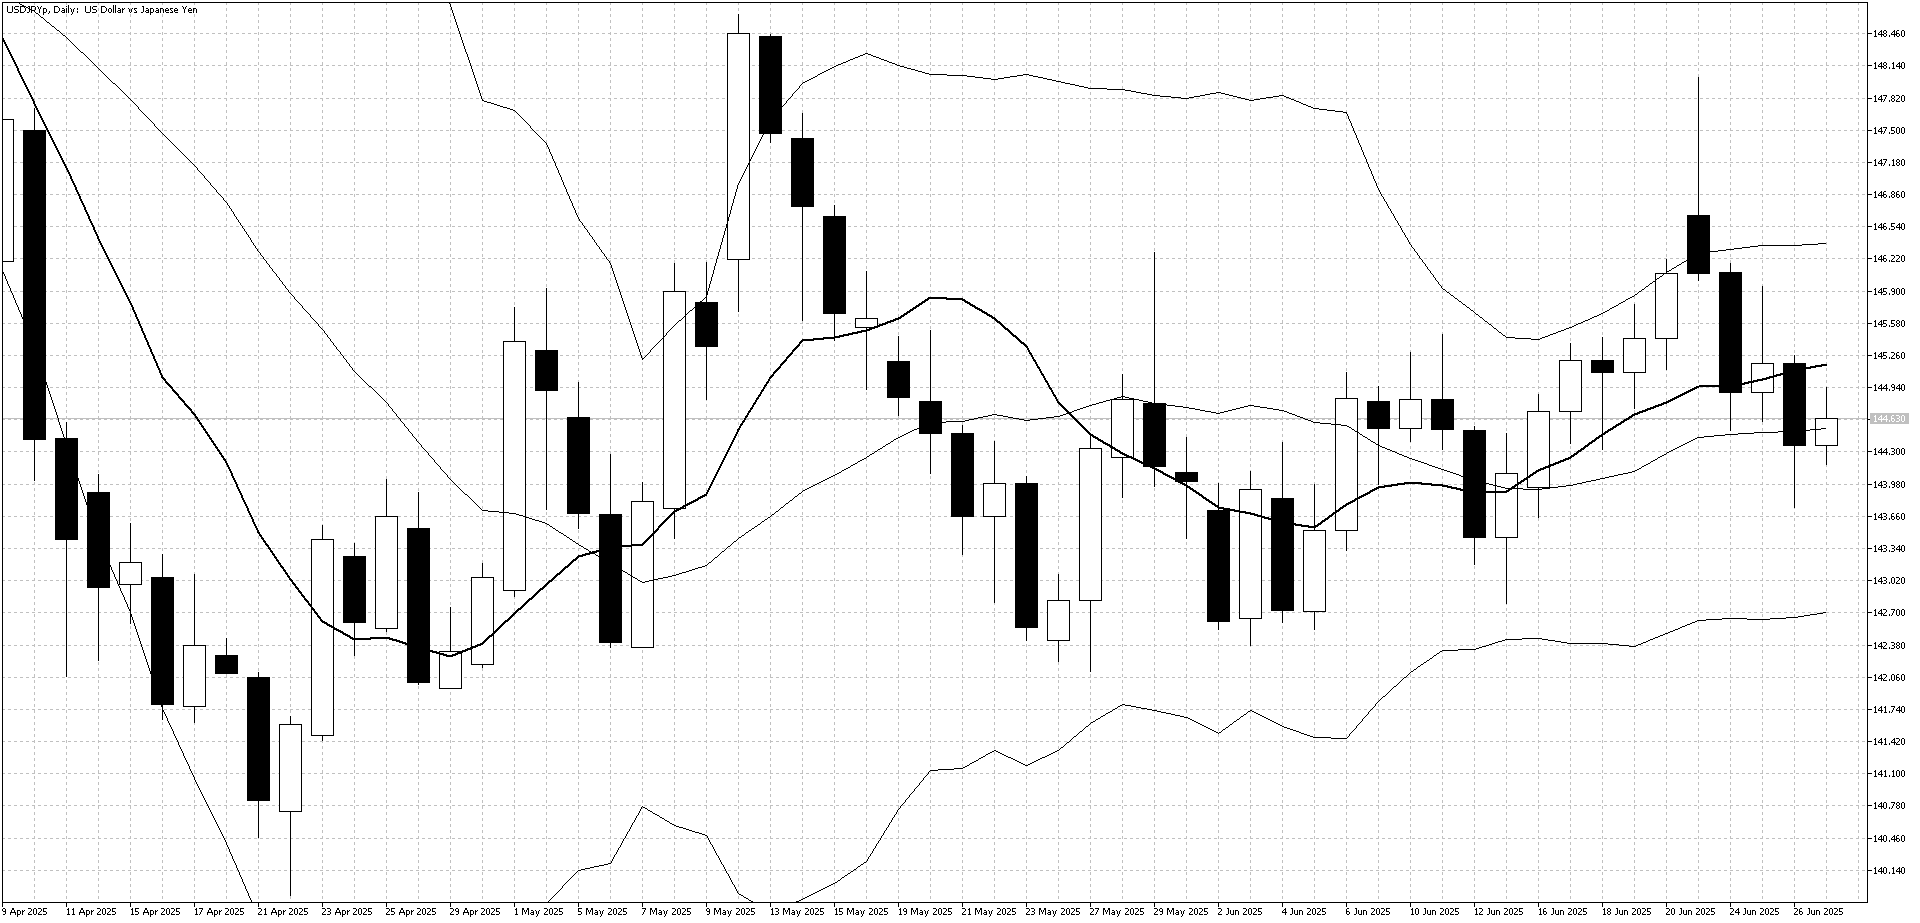
After starting the week strong, USD/JPY came under pressure as long-term U.S. interest rates fell following weak economic data and renewed pressure from former President Trump on the Federal Reserve to cut rates.
Technical Picture:
It was a disappointing week for USD/JPY, breaking the recent uptrend. The pair hit resistance at the upper Bollinger Band and has since pulled back. The 10-day moving average now points to a sideways market.
Outlook This Week:
With the U.S. dollar still under pressure, range trading looks like the best strategy. The market will be watching to see if support holds around 144 and whether the pair can begin to recover.
GBP/JPY
Last Week Recap:
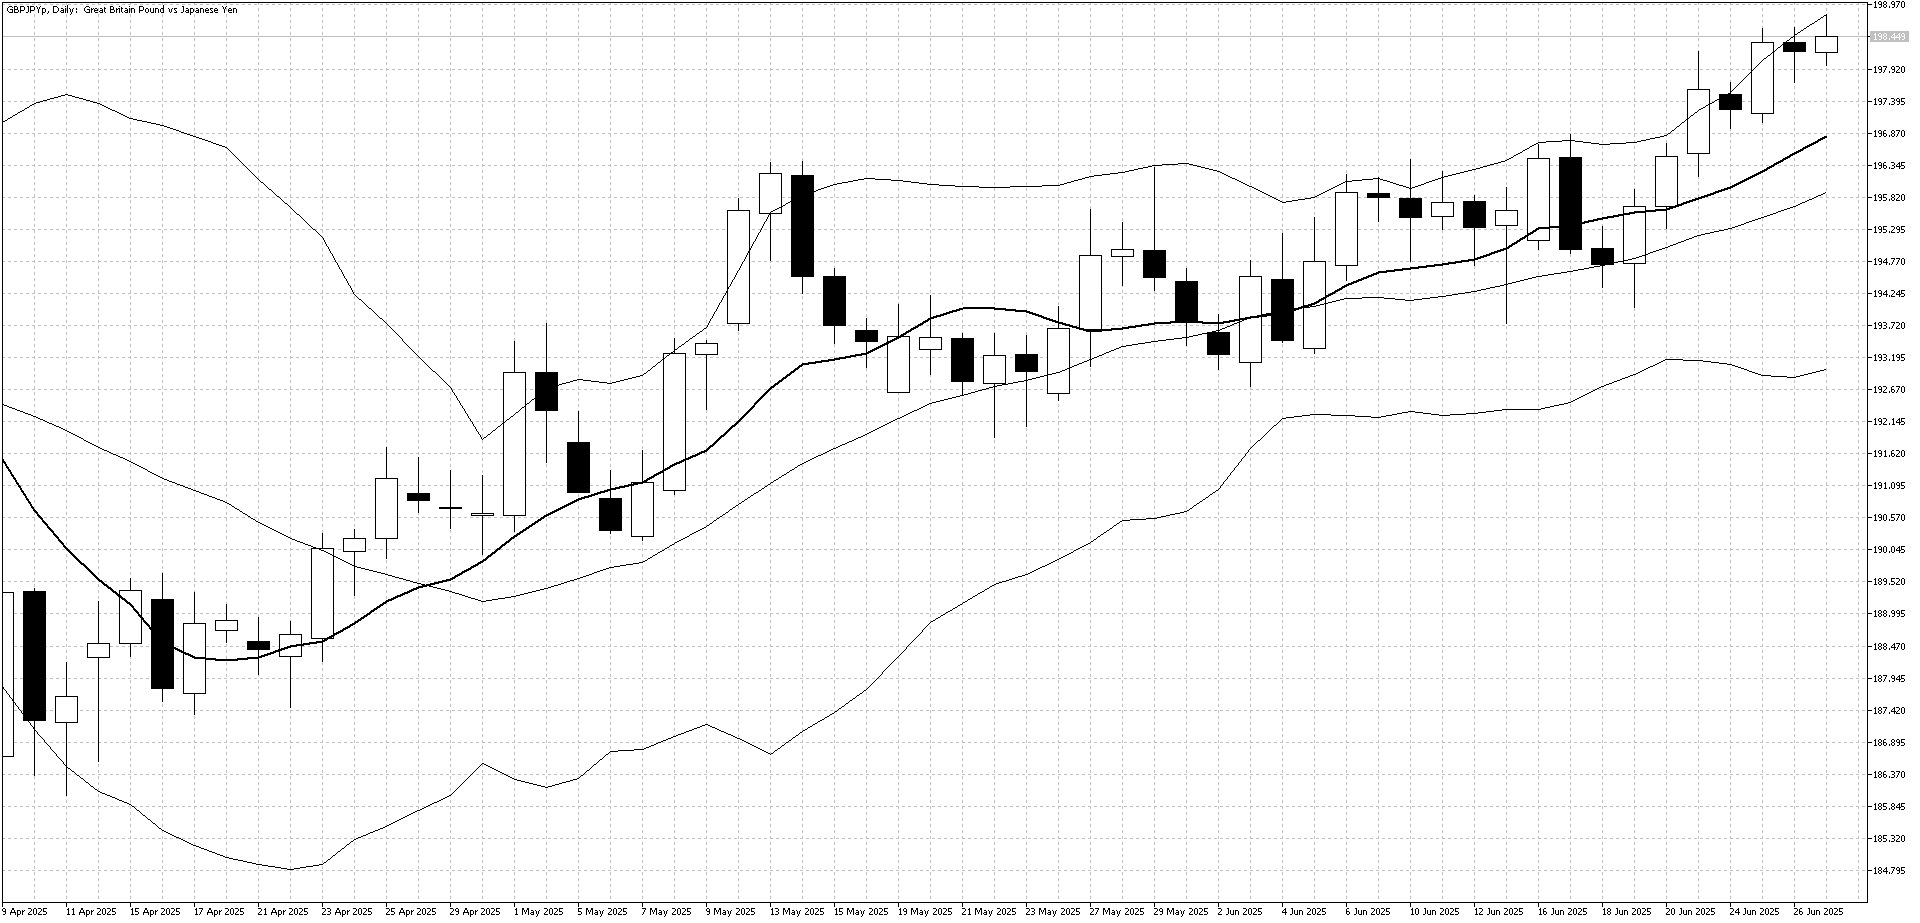
GBP/JPY pushed higher throughout the week, moving toward the key 200 level. While U.K. data remained weak, the pound gained strongly as falling U.S. interest rates made the GBP more attractive compared to the yen.
Technical Picture:
The strong uptrend continued, with the pair testing the upper Bollinger Band. However, as the price approached major resistance at 200, sellers began to step in more confidently.Outlook This Week:
GBP/JPY is likely to consolidate recent gains and trade sideways to lower as it approaches resistance at the 200 level.
EUR/JPY
Last Week Recap:
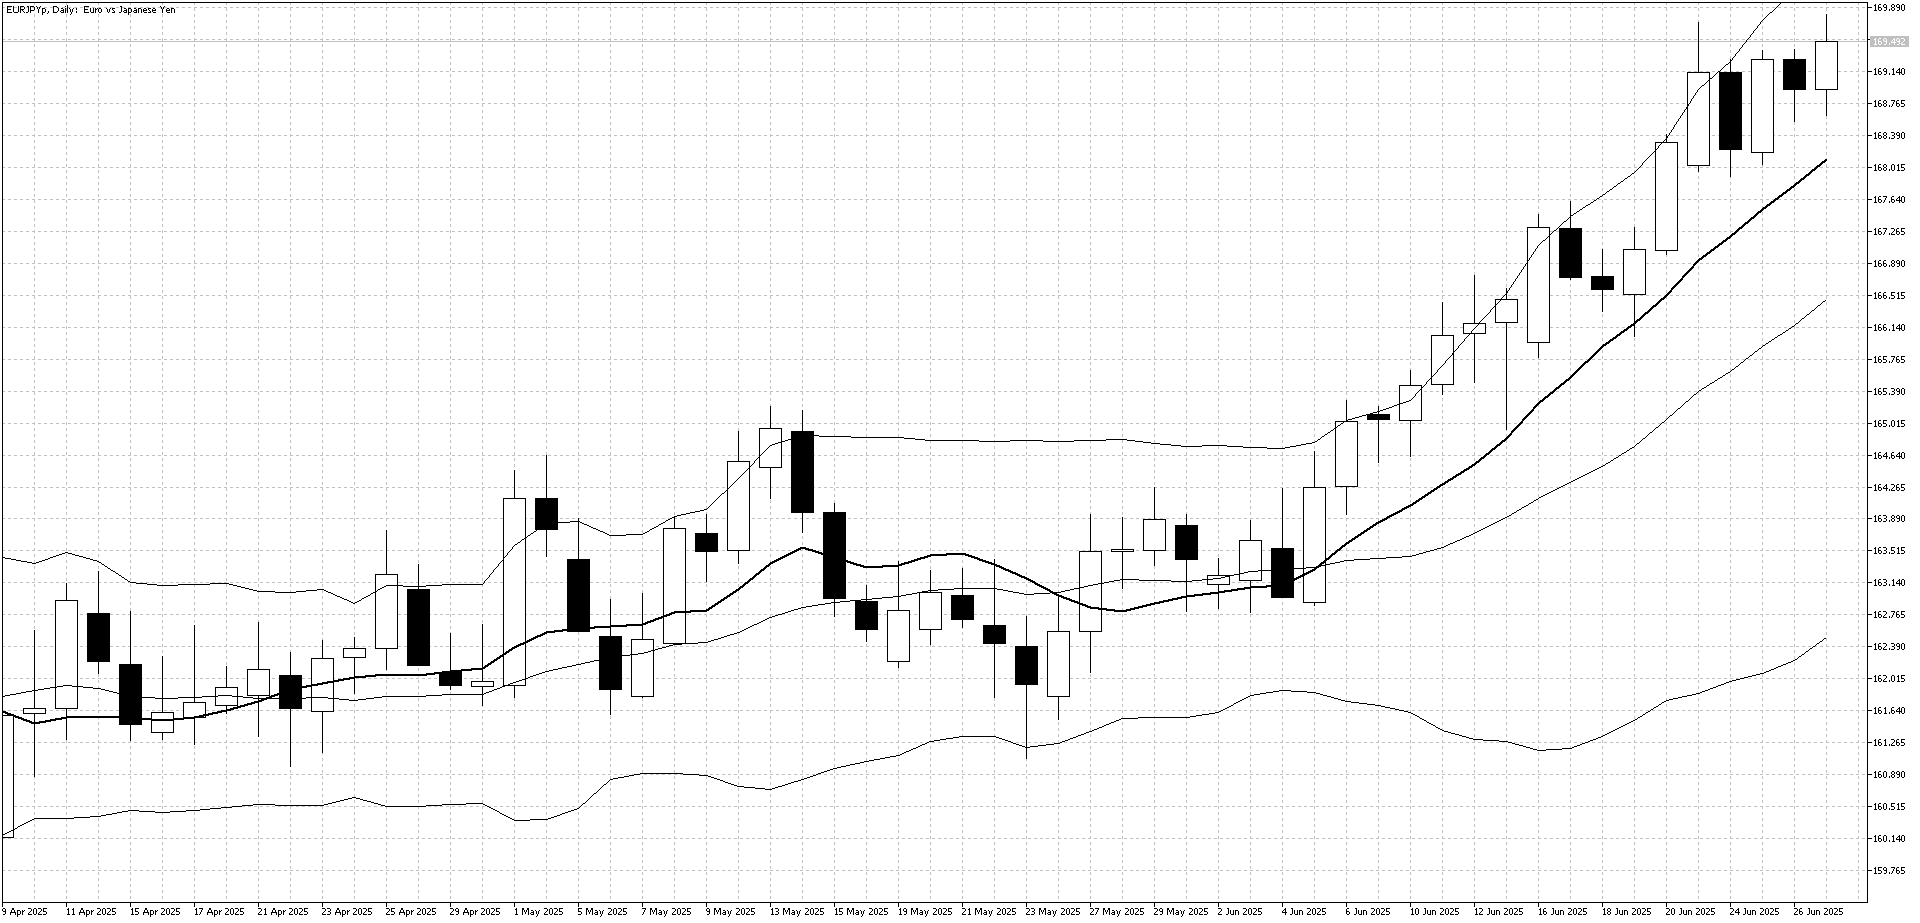
EUR/JPY had another positive week, reaching new highs for 2025 as the strong euro pushed the pair higher. Markets are now forecasting that the gap between European and Japanese interest rates may start to narrow, supporting euro strength.
Technical Picture:
The upper Bollinger Band acted as resistance last week, limiting further gains, while the 10-day moving average continues to slope upward and provide support.
Outlook This Week:
After a strong rally through June, EUR/JPY looks due for some profit-taking. Selling opportunities may be more favorable this week as the market begins to cool off from recent highs.
AUD/JPY
Last Week Recap:
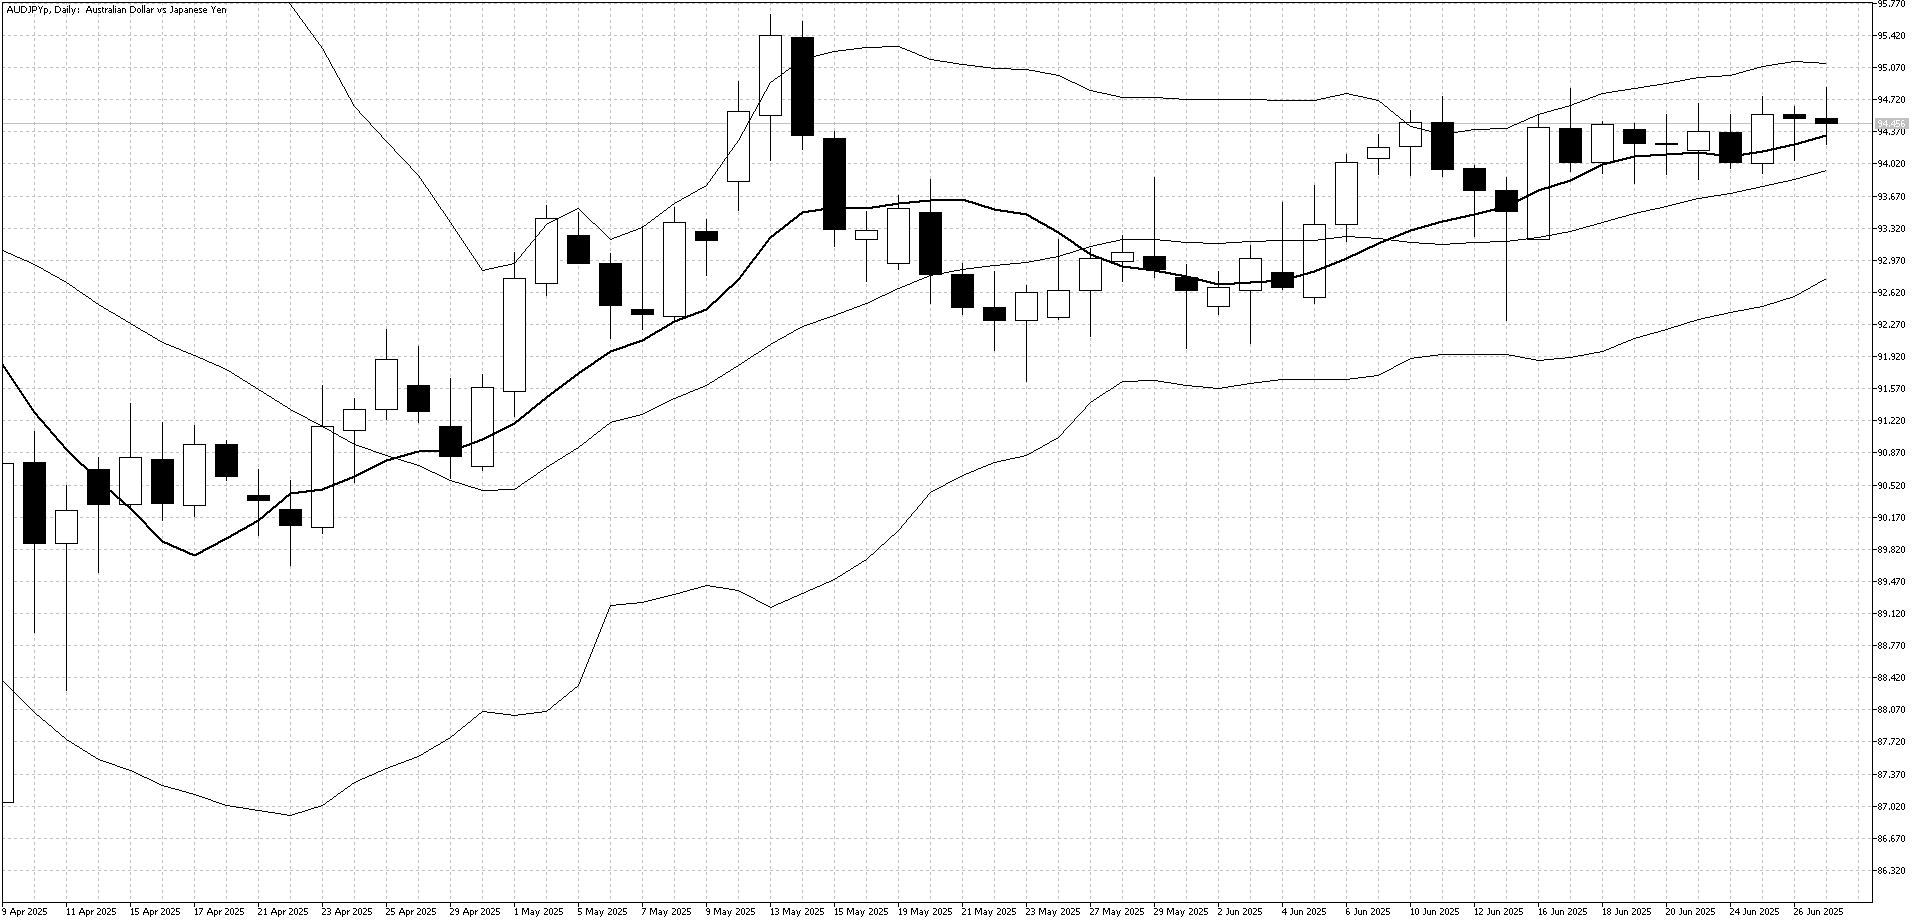
AUD/JPY continued to trade quietly in a narrow range last week, as movements in the Australian dollar and Japanese yen against the U.S. dollar were closely matched, keeping the pair stable.
Technical Picture:
The 10-day moving average remains flat, showing a lack of clear direction. The top of the 91.50 to 95.00 range continues to act as resistance, making it difficult to predict the next major move.Outlook This Week:
AUD/JPY remains a good pair for short-term range trading while it stays within the 91.50–95.00 band. Medium-term traders may consider selling near the 95 resistance level until a clear breakout occurs.
NZD/JPY
Last Week Recap:
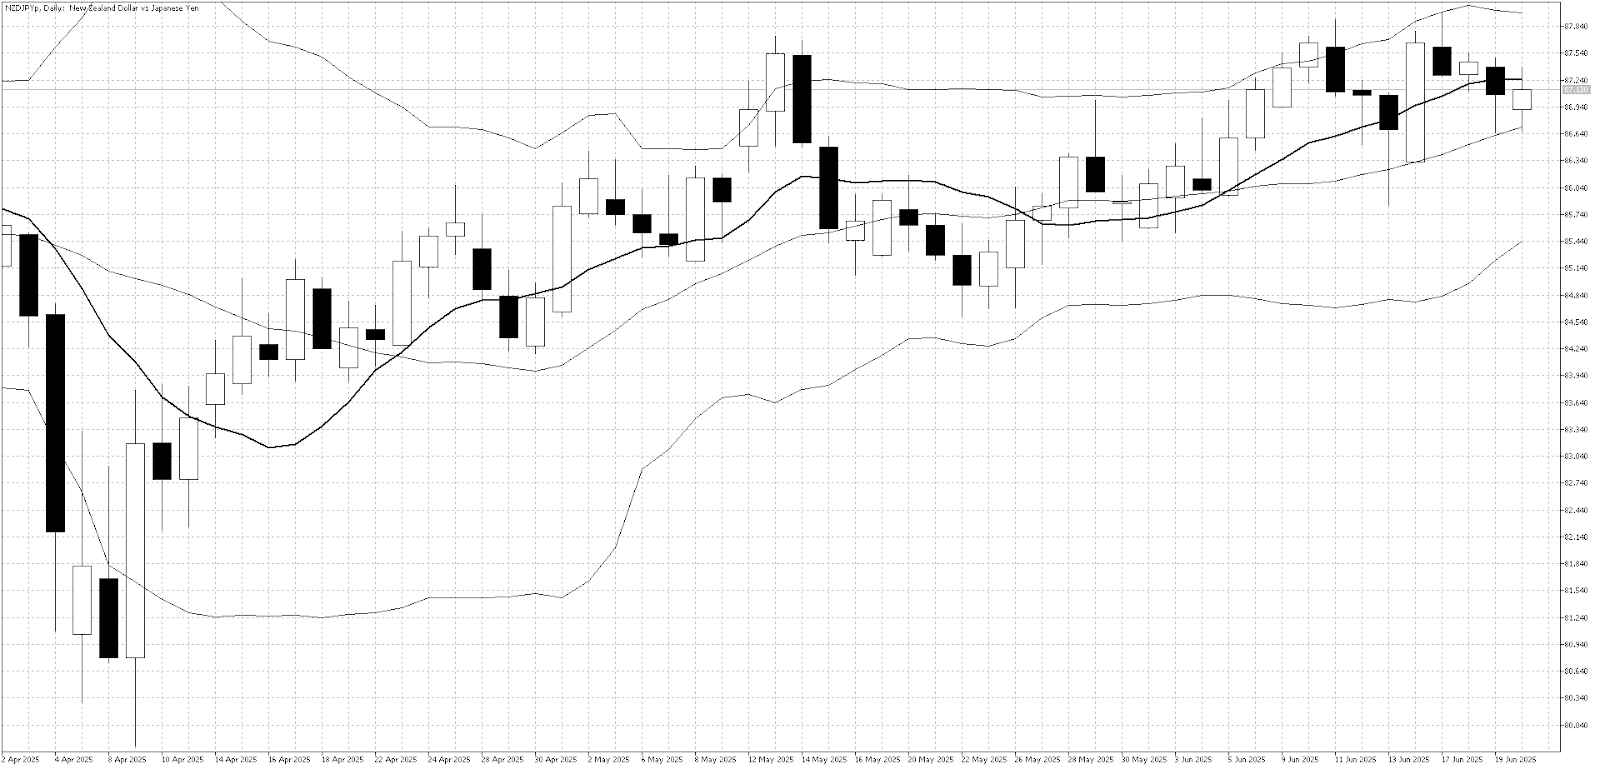
NZD/JPY continued to test higher last week as easing tensions in the Middle East supported risk sentiment and provided a boost to the pair.
Technical Picture:
The trading range is narrowing, and the 10-day moving average is moving sideways. Resistance at 88 remains firm, limiting further upside momentum.
Outlook This Week:
Range trading between 86 and 88 remains the preferred strategy in the short term, as the market waits for a clear signal to determine the next major move.
EUR/USD
Last Week Recap:
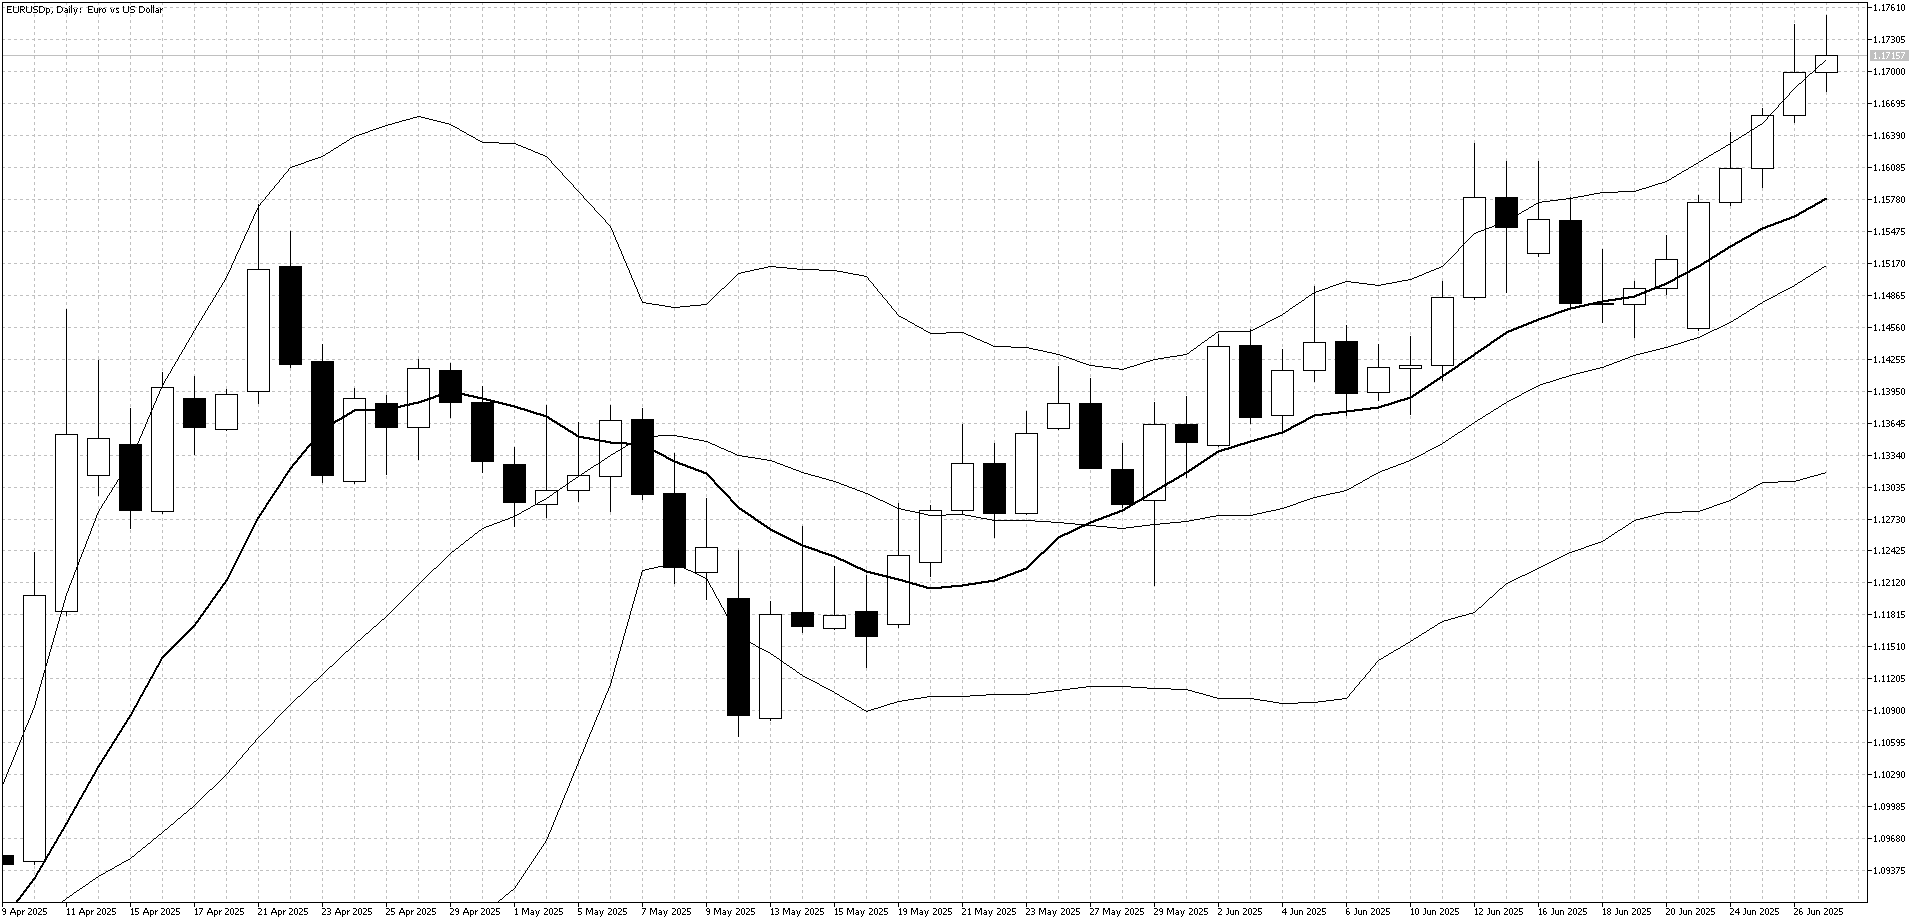
EUR/USD rose every day last week as traders bet that the ECB is nearly done cutting rates and the U.S. will move faster to lower rates under pressure from former President Trump. With little resistance on the chart, strong buying pushed the pair to new four-year highs.
Technical Picture:
The upper Bollinger Band is still pointing higher and acting as resistance. The price is now well above the 10-day moving average, which may lead to short-term selling as the market cools down.
Outlook This Week:
EUR/USD looks overbought and could move lower this week. Selling is likely to be the better strategy as the market pulls back after strong recent gains.
GBP/USD
Last Week Recap:
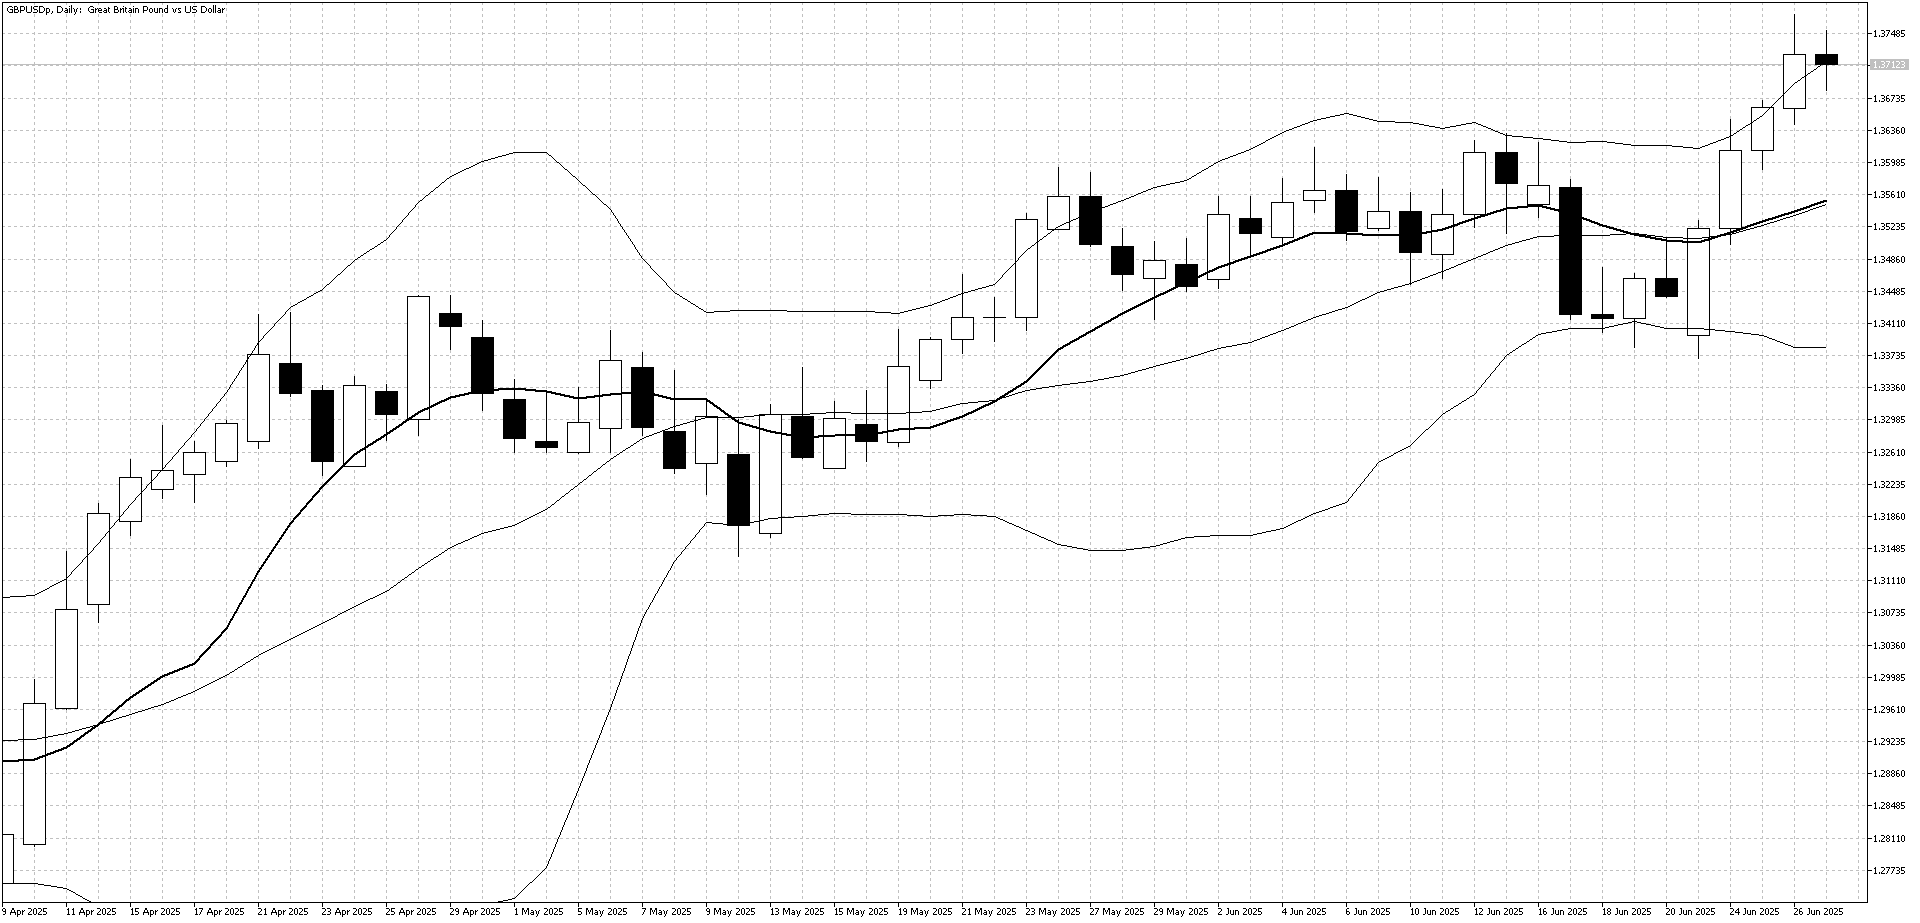
GBP/USD attracted strong buying last week, climbing to fresh three-year highs as the U.S. dollar was broadly sold across major currencies. Despite continued weakness in U.K. economic data, traders focused on the faster-than-expected decline in U.S. interest rates.
Technical Picture:
GBP/USD bounced off the lower Bollinger Band early in the week and quickly returned to the upper band—a rare move that highlights U.S. dollar weakness. However, the upper band attracted selling pressure, capping gains by the end of the week.
Outlook This Week:
Last week’s rise in GBP/USD was stronger than expected, and some profit-taking is likely. Traders may look to sell this week, with the market expected to pull back toward the 10-day moving average.
Equities
U.S. Stock Market
Last Week Recap:
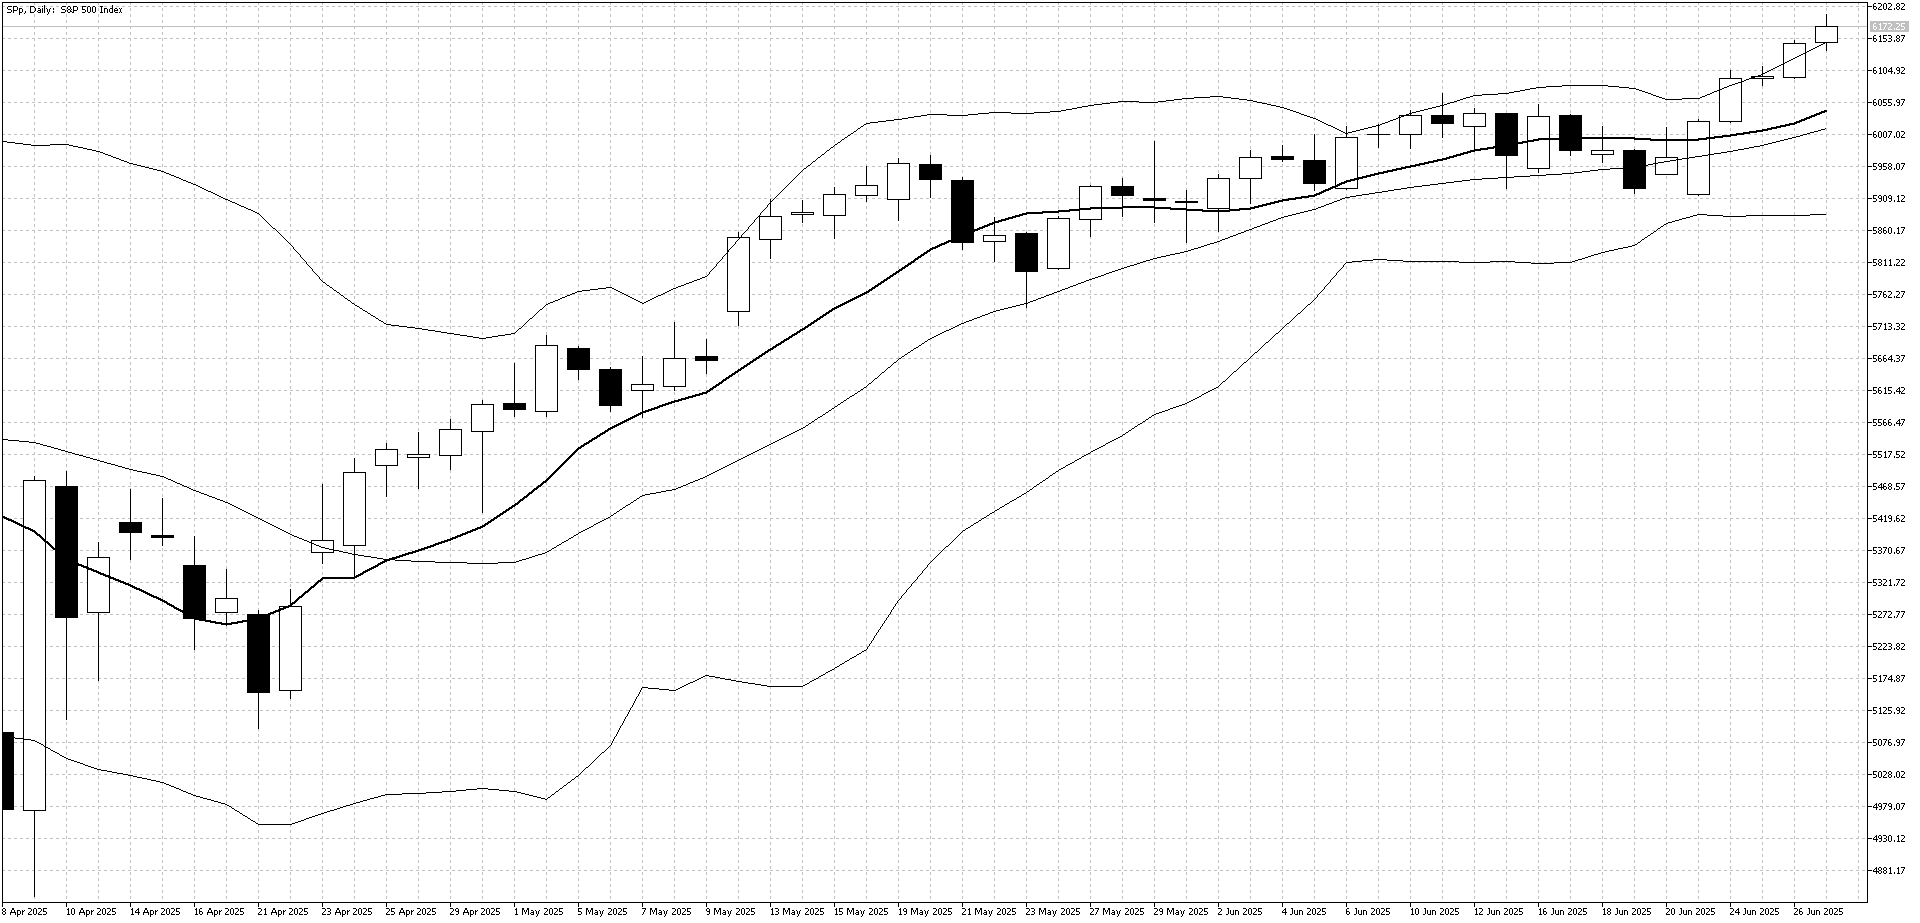
It was a very strong week for the S&P 500, as a ceasefire between Israel and Iran combined with falling long-term U.S. interest rates encouraged strong buying. U.S. equities have now returned to positive territory for 2025, boosting investor confidence.
Technical Picture:
The move back above the key 6000 level improved the technical outlook, with the S&P 500 tracking the upper Bollinger Band higher throughout the week.Outlook:
Market sentiment remains very positive, but with the U.S. tariff negotiation deadline approaching next week and a market holiday on Friday, the S&P 500 is more likely to trade sideways in the short term.
Japan Equities
Last Week Recap:
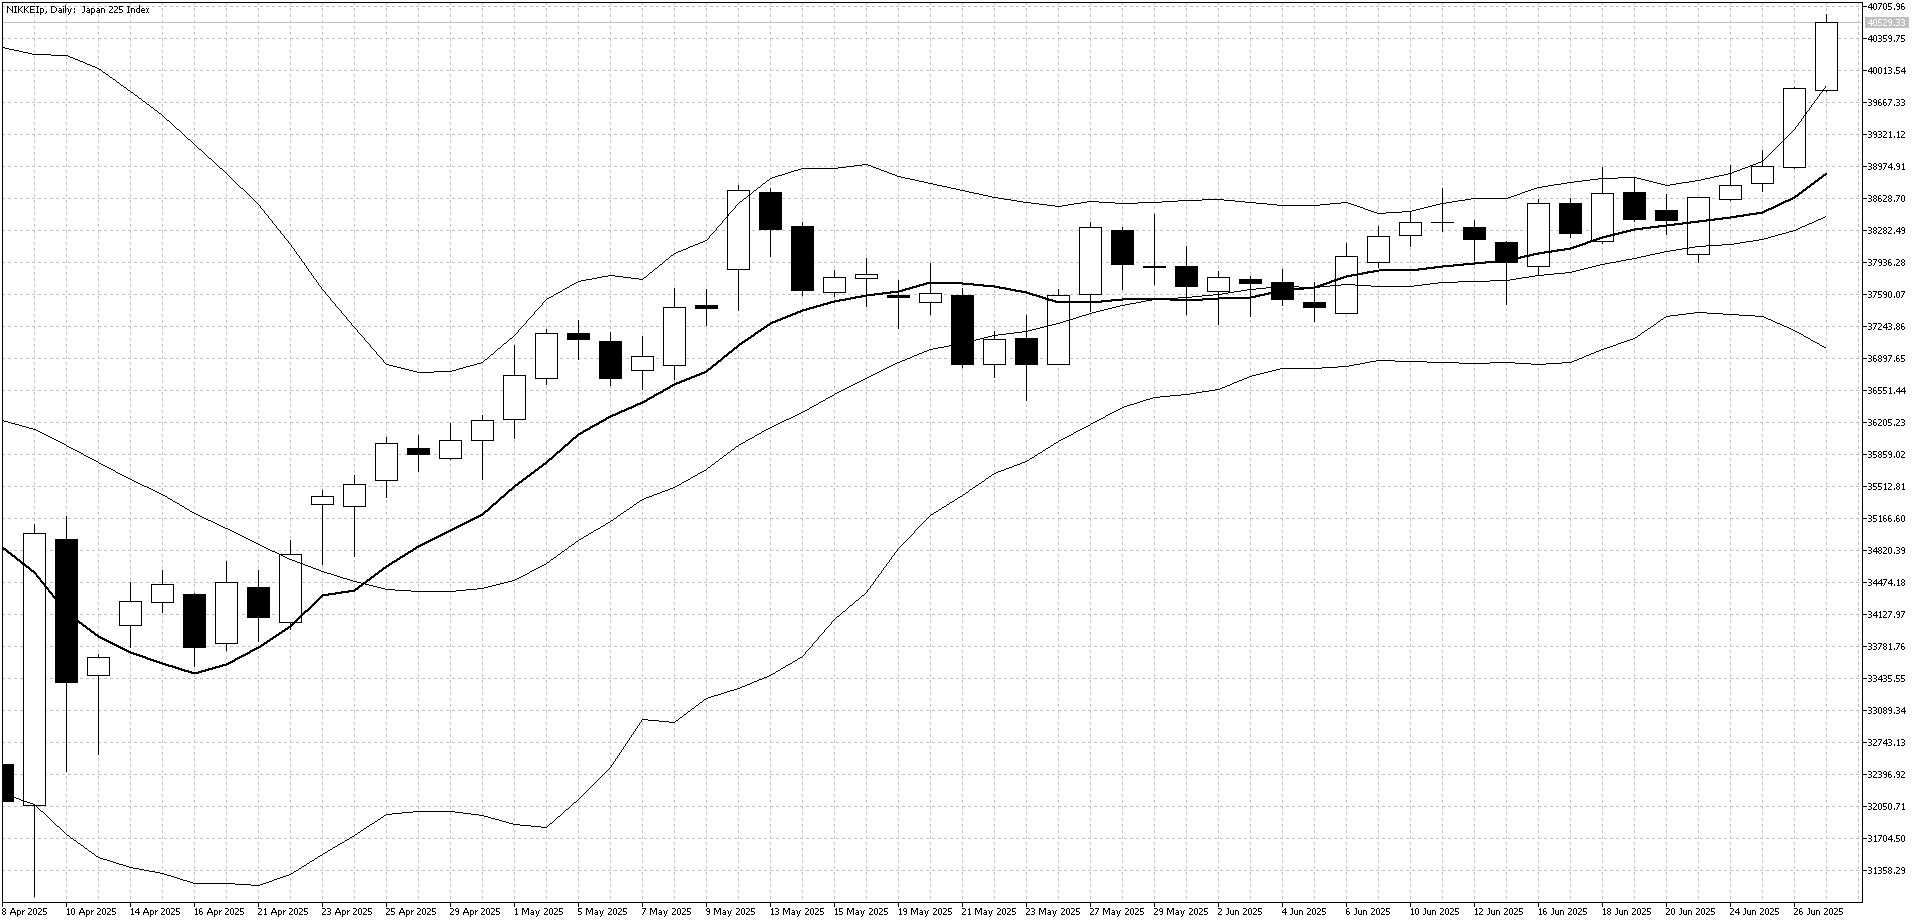
The Nikkei 225 surged last week after breaking above the key 39,000円 level, following strength in U.S. equities that pushed the index higher. The market had been range-bound for some time, which added to the buying pressure once resistance was cleared.
Technical Picture:
The index moved easily above the upper Bollinger Band, which had been tight in recent weeks. The 10-day moving average is now turning upward, supporting the rally, but a wide gap between the current price and the moving average suggests the market is overbought in the short term.
Outlook This Week:
With U.S.–Japan tariff negotiations approaching the July 8 deadline, traders may be cautious about buying at these higher levels. Range trading is likely to continue until there is news from the talks, and a potential sell-off could follow if no tariff relief is announced.
Commodities
Gold
Last Week Recap:
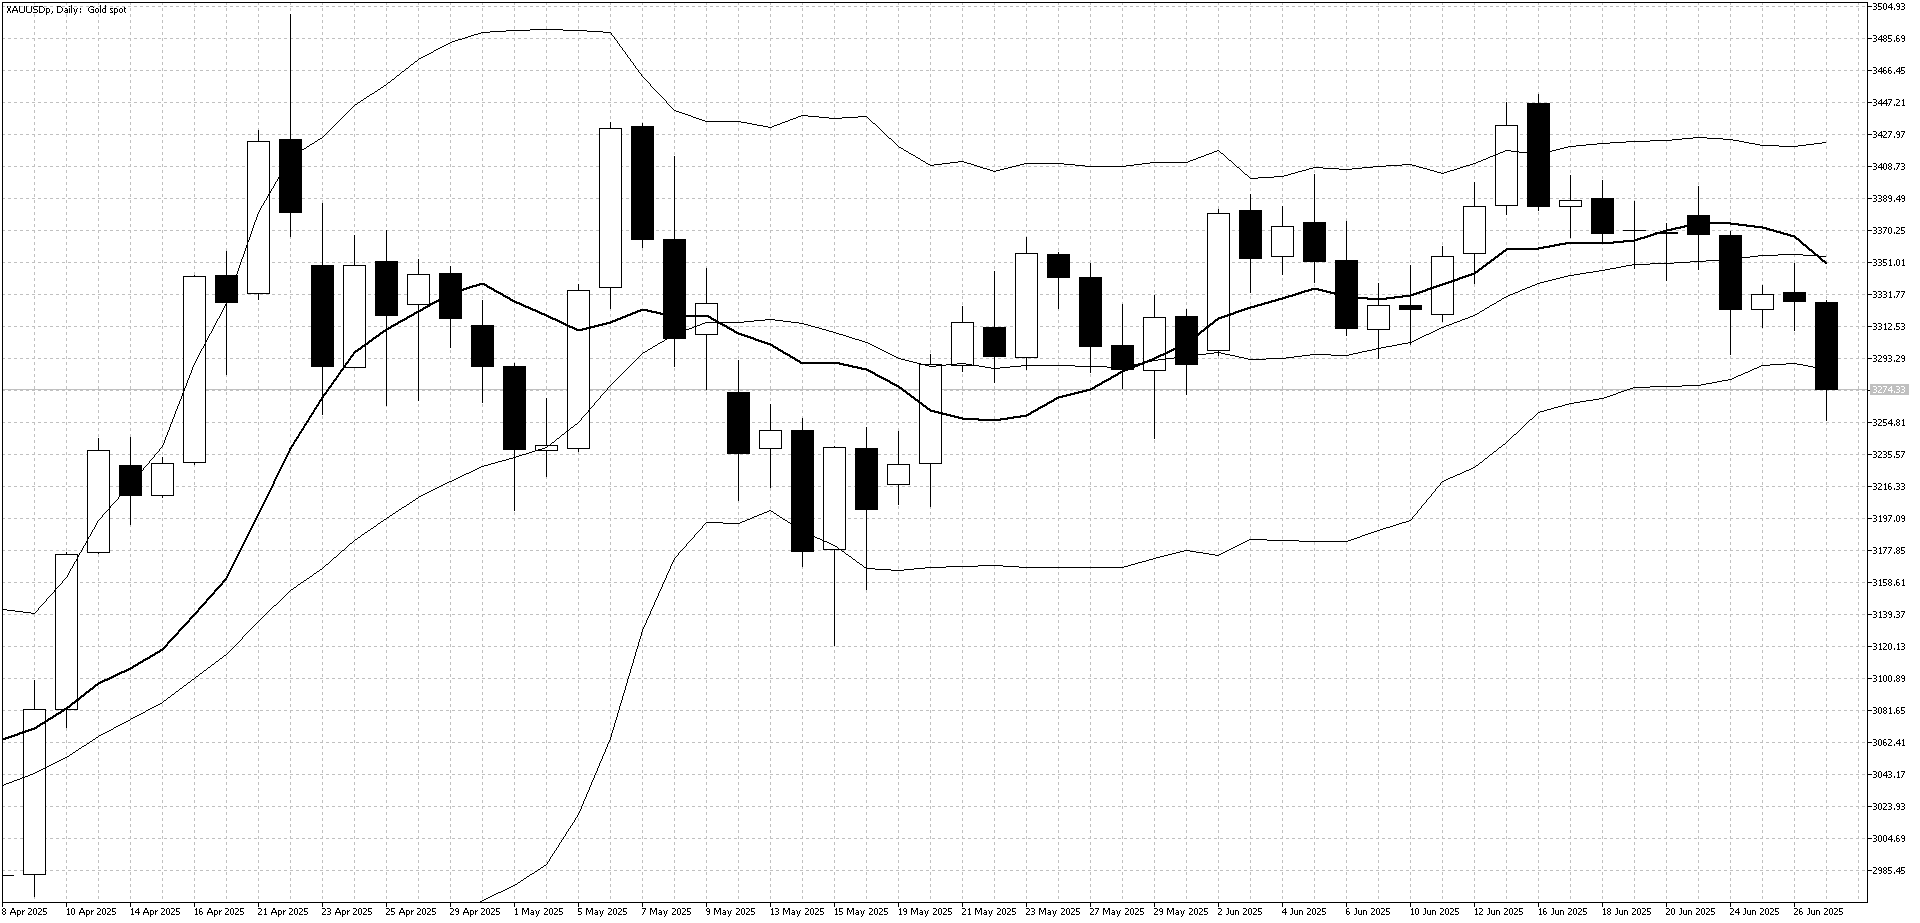
Gold came under steady pressure last week as easing Middle East tensions reduced safe-haven demand. At the same time, strong gains in U.S. equities reflected rising risk appetite, which pulled further money away from gold. Prices closed at their lowest level in over a month.
Technical Picture:
The market dropped to the lower Bollinger Band, and the 10-day moving average has turned downward, indicating a shift to a weaker short-term trend.
Outlook This Week:
Gold is now approaching medium-term support and may begin to attract renewed buying interest, especially with the U.S. tariff deadline nearing and the U.S. dollar still under pressure.
Crude Oil
Last Week Recap:
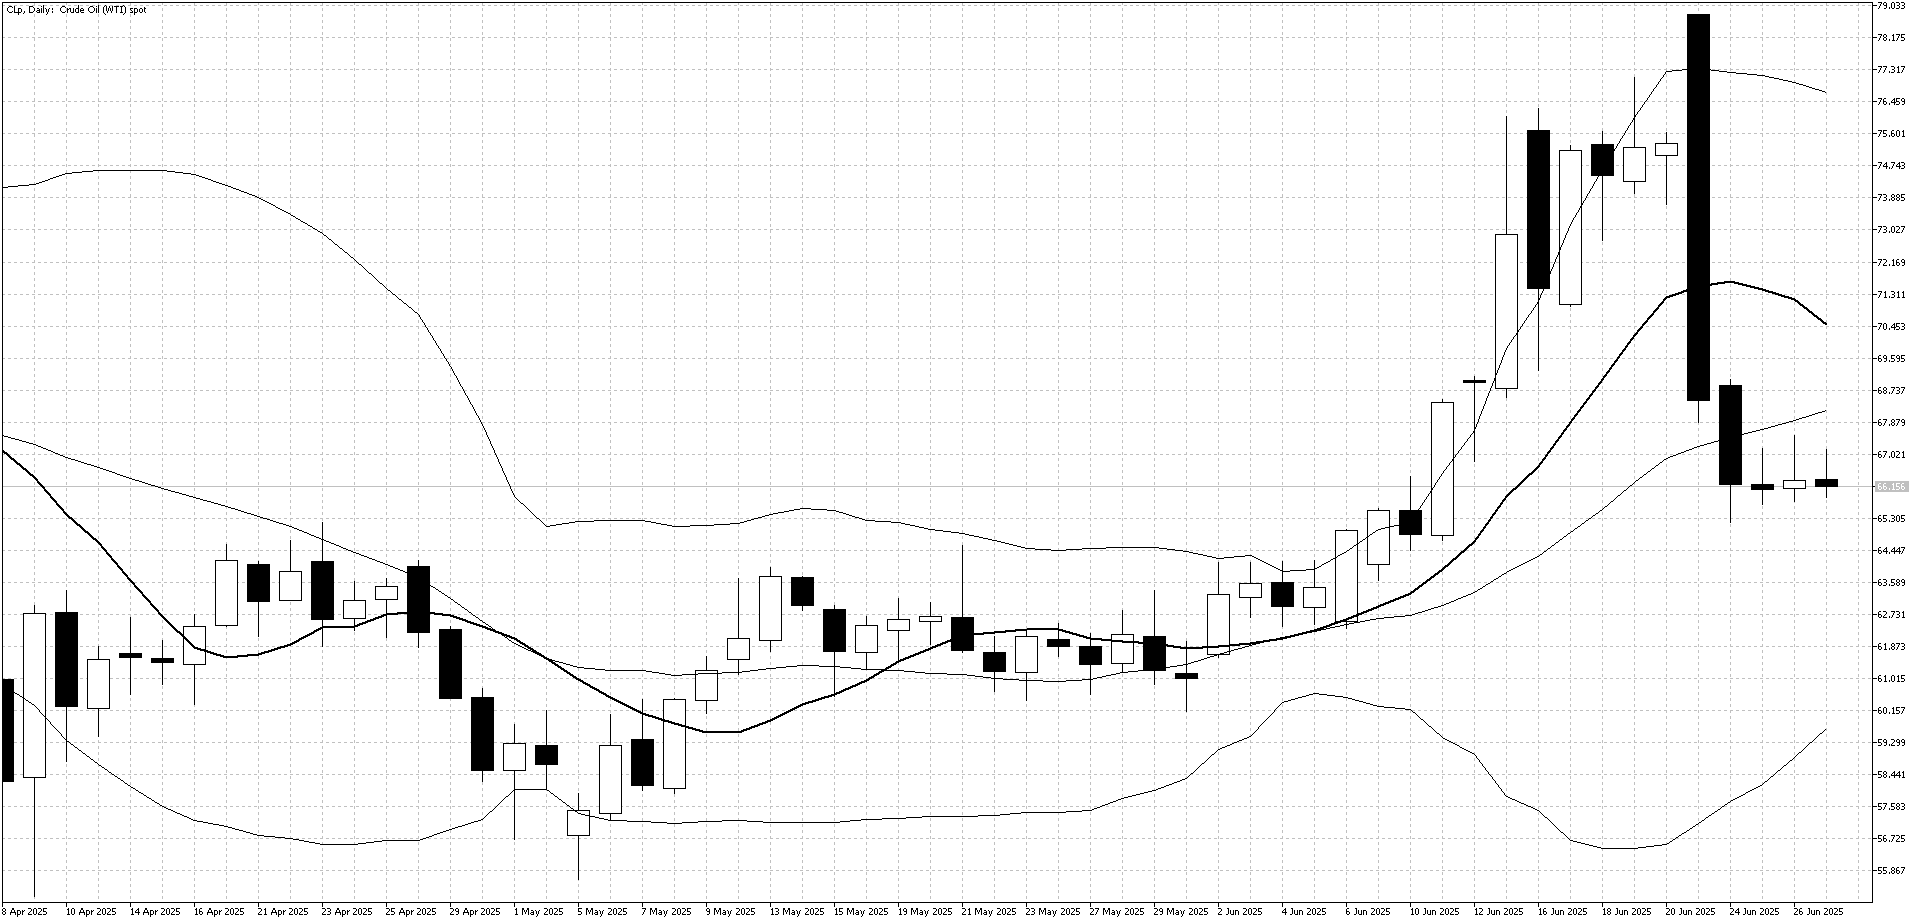
Crude oil prices dropped sharply last week as tensions between Israel and Iran eased and the U.S. pushed for a ceasefire. The sell-off was fast and aggressive, with many speculators rushing to close positions, pushing prices back to levels seen before the conflict began.
Technical Picture:
The market found support near the previous resistance level at $65. There is now a wide gap between current prices and the 10-day moving average below, suggesting that buyers may soon return if sentiment shifts.
Outlook This Week:
Crude oil is likely to remain sensitive to headlines from the Middle East, which are difficult to predict. If tensions rise again, look for buying opportunities, especially as the market appears technically oversold.
Markets face an important week as the U.S. tariff freeze ends on July 8 and 9. Investors will be watching for news on trade talks, especially with Japan and the EU, to see if new tariffs will be announced. The main focus is on when the Federal Reserve might cut interest rates, and Fed Chair Powell’s speech on Tuesday could give important hints. U.S. employment data will come out on Thursday, one day early because of the holiday on Friday. Tensions in the Middle East have calmed, but the situation could become important again if problems return.
