Market Sector Scanner: Key Points to Watch: Much Stronger U.S. Employment Data Triggers Sharp Equity Sell-Off
Markets were calm for most of last week, but strong U.S. employment data changed sentiment on Friday. USD/JPY moved above 160, gold fell, and equities sold off sharply. This week, traders will watch U.S. CPI, PPI, and the ECB rate decision.

Markets were calm for most of the week, with equities and the U.S. dollar moving higher while oil traded sideways. Bitcoin stayed under strong pressure as investors looked for better opportunities elsewhere. Sentiment changed on Friday after U.S. employment data was much stronger than expected, raising concerns that the Fed may need to keep rates high or even raise them again. USD/JPY moved above 160 as the Bank of Japan did not intervene, while gold fell and equities sold off sharply.
Scan for opportunities on:
Forex Market
USD/JPY
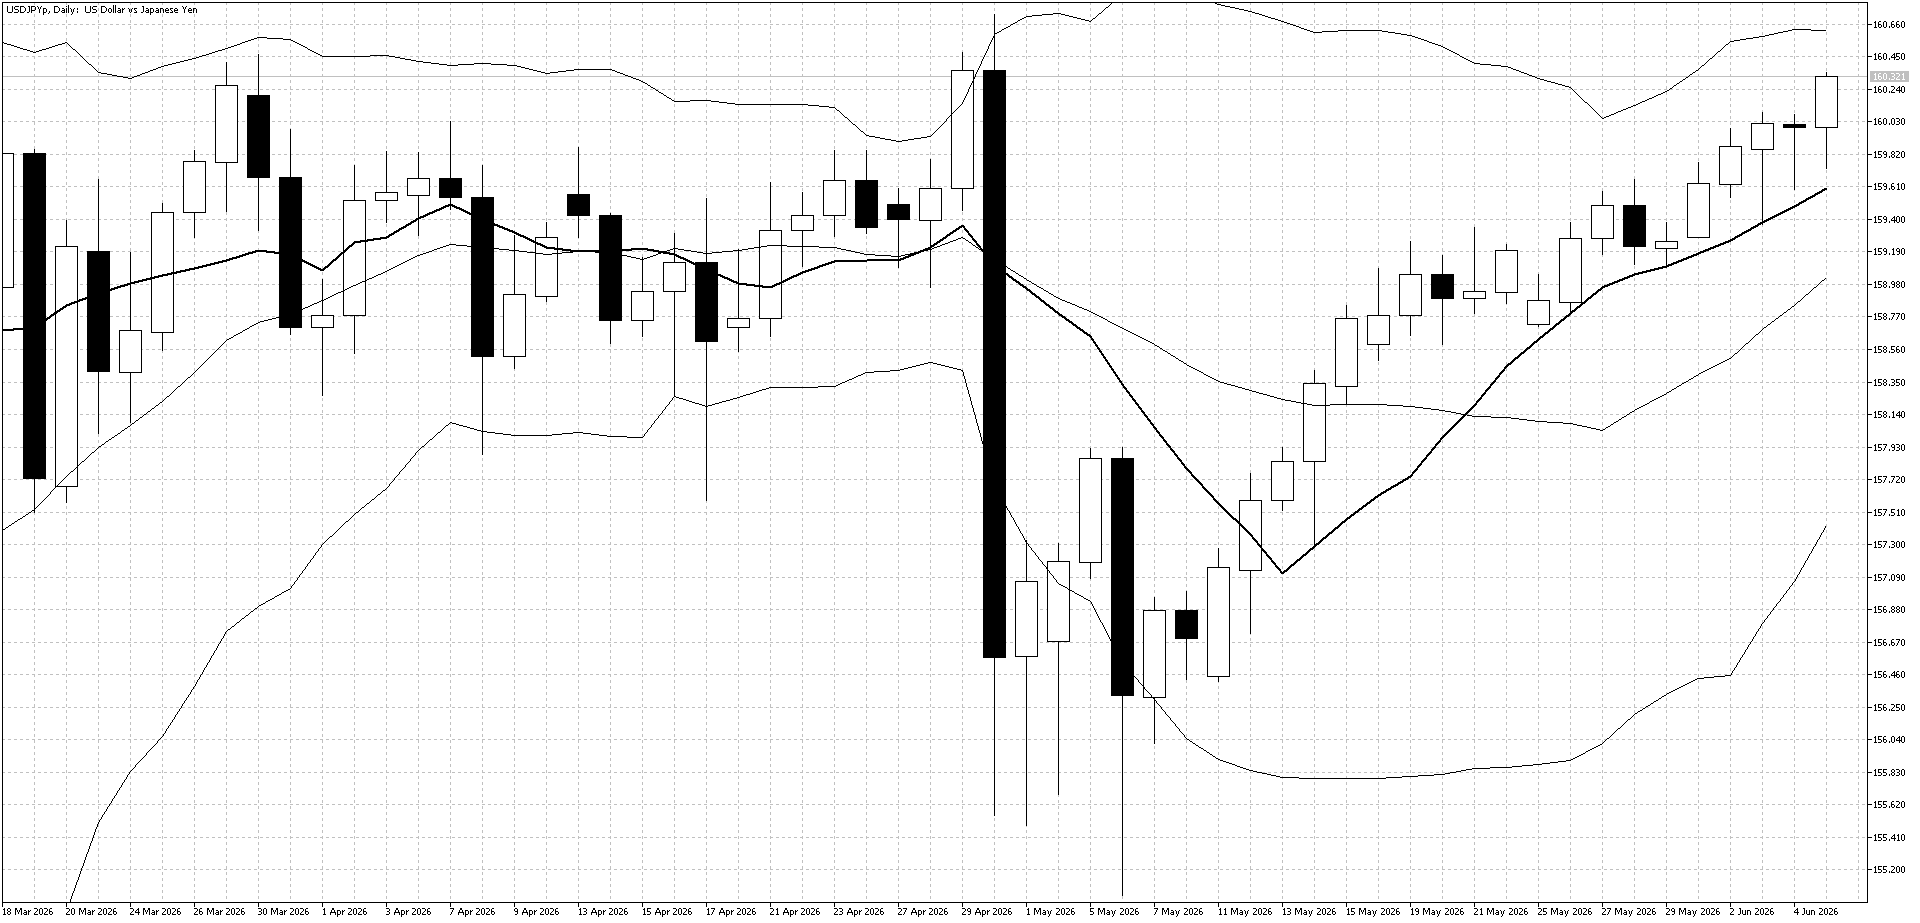
Last Week Recap
Strong U.S. employment data helped USD/JPY close above 160 last week, as markets started to expect a higher chance of further U.S. rate hikes. Comments from the Bank of Japan suggesting that rates could rise in June had little impact, as the BOJ did not intervene.
Technical Picture
The uptrend remains in place. The 10-day moving average continued to act as support and attract buyers. The next key resistance levels are around 161 and the upper Bollinger Band.
Outlook This Week
It is still difficult to buy USD/JPY aggressively at these high levels. For now, traders may prefer to wait for the uptrend to break. A move below the 10-day moving average could create a selling opportunity.
GBP/JPY
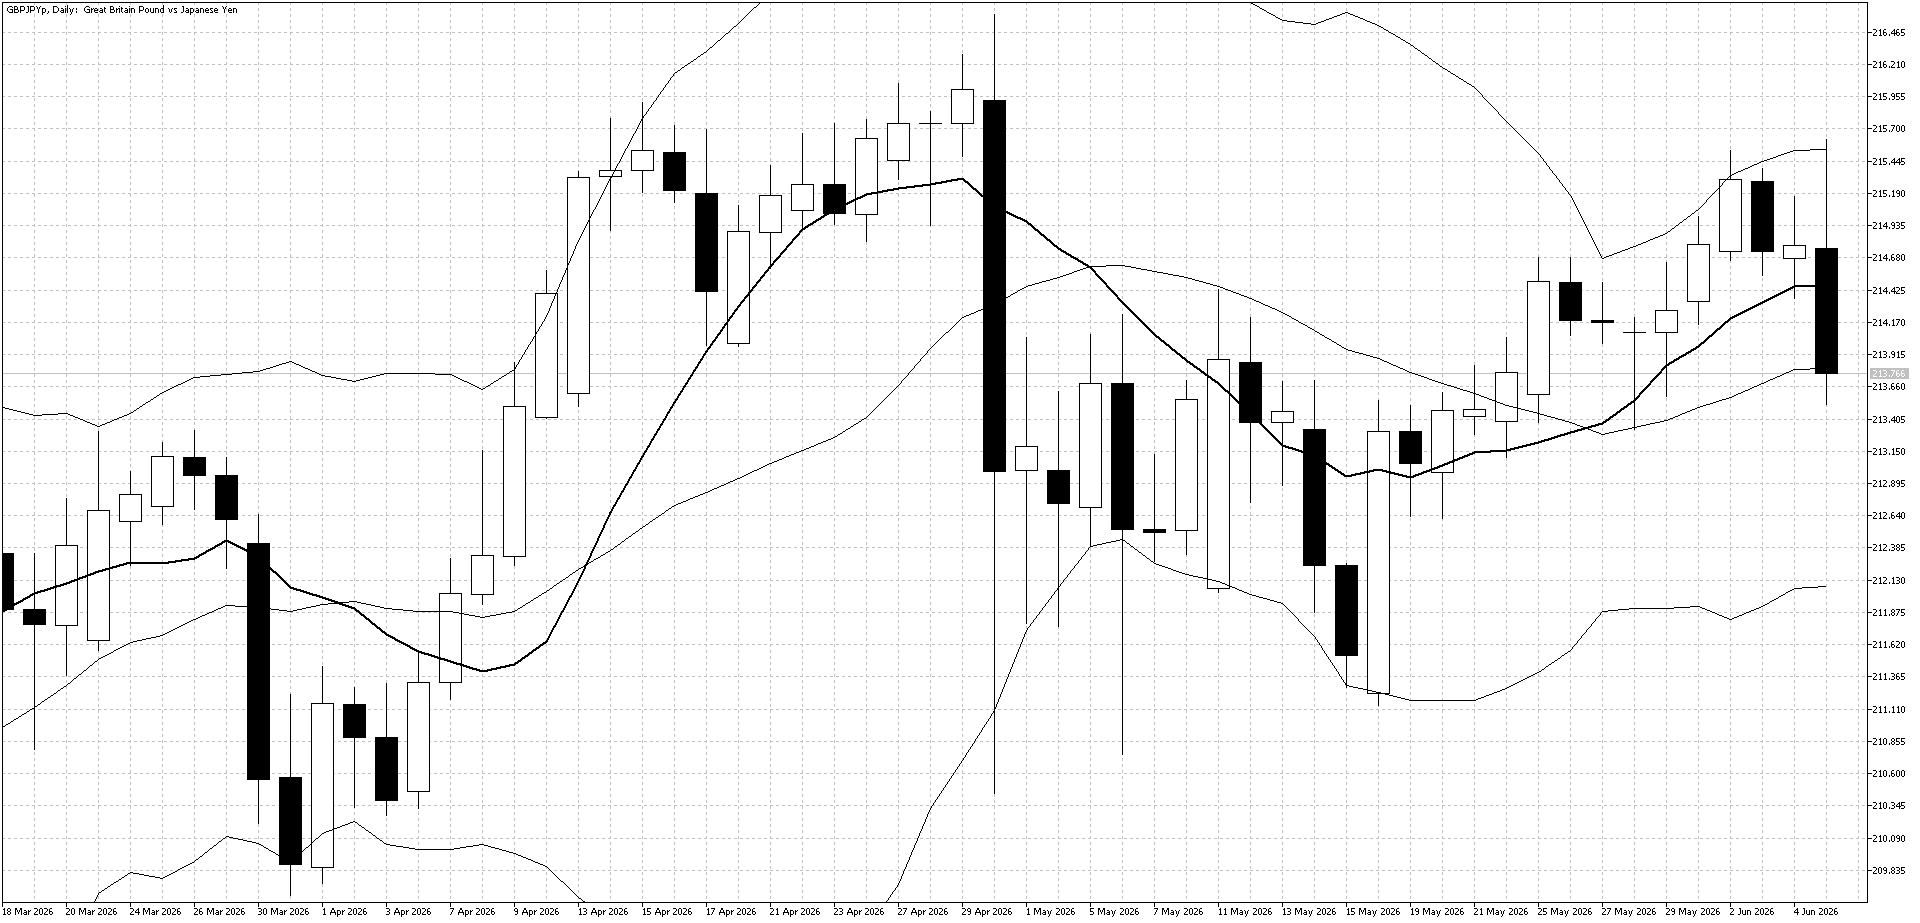
Last Week Recap
GBP/JPY moved higher for most of last week as yen weakness supported the pair. However, strong U.S. employment data caused the U.S. dollar to strengthen sharply against the pound, leading to a large reversal in GBP/JPY.
Technical Picture
The upper Bollinger Band acted as resistance last week. The weekly close below the 10-day moving average suggests the short-term uptrend may have ended.
Outlook This Week
GBP/JPY is likely to remain under pressure this week. Traders may look to sell strength, especially ahead of the important U.S. inflation data.
EUR/USD
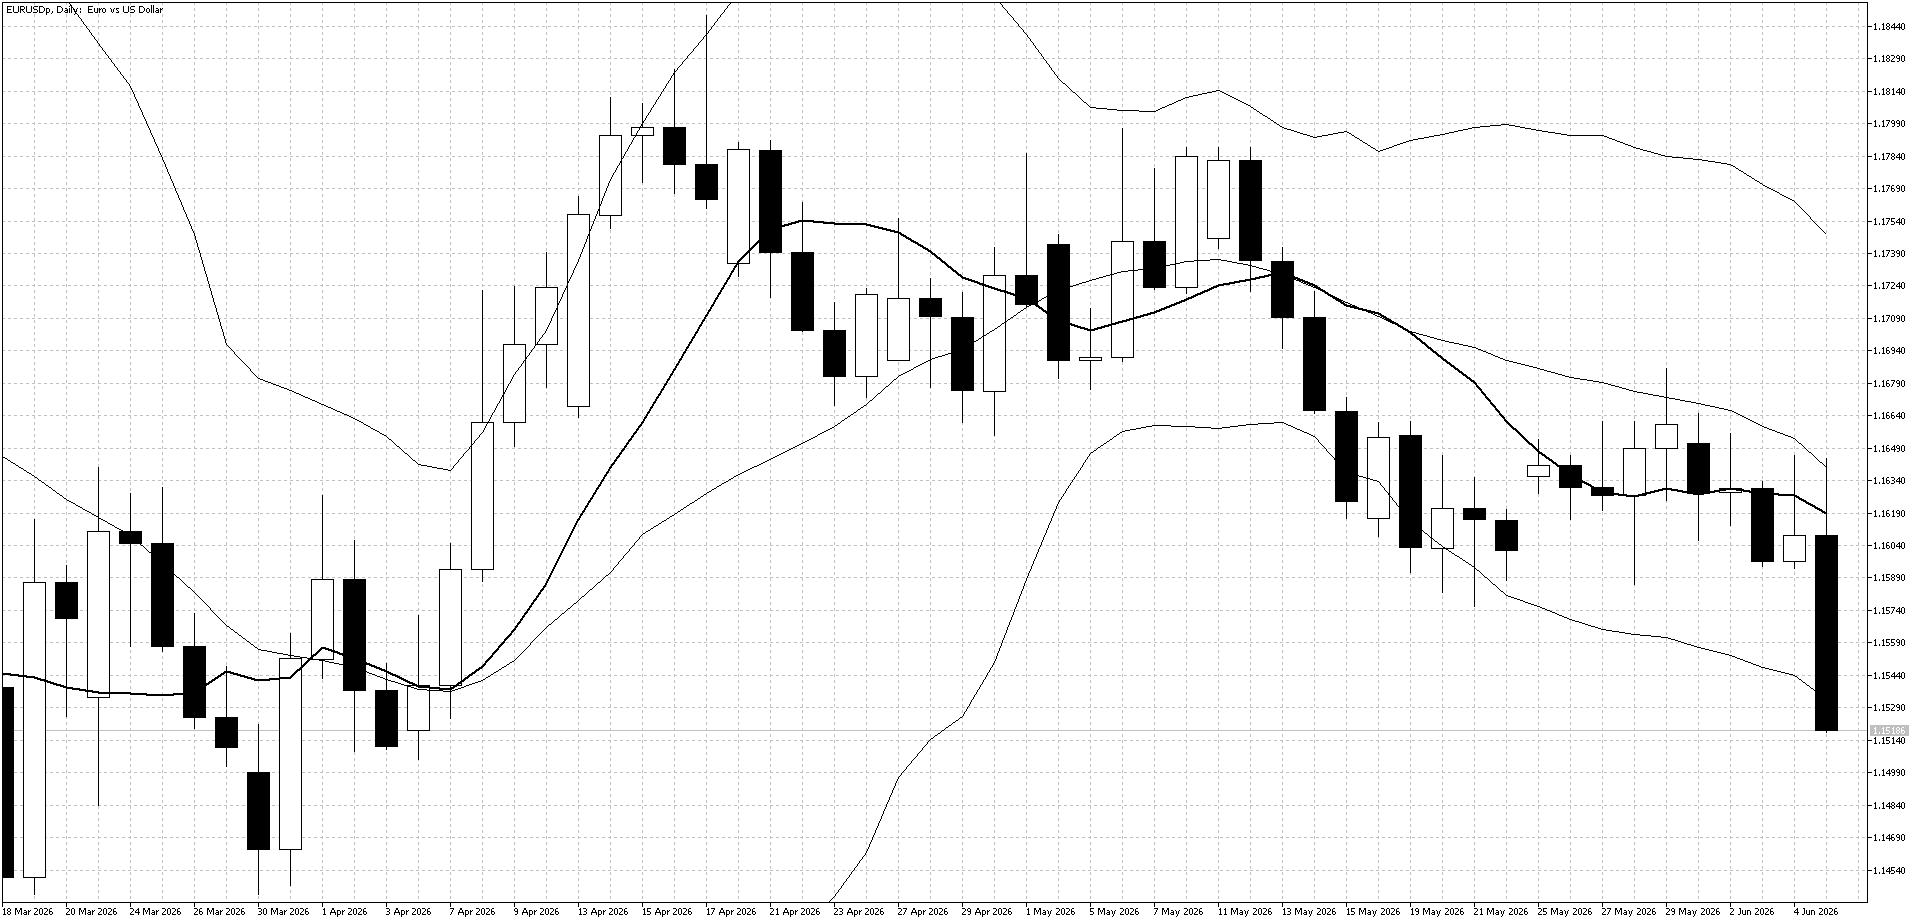
Last Week Recap
The downtrend in EUR/USD resumed last week, with rising WTI crude oil prices encouraging selling earlier in the week. The much stronger-than-expected U.S. employment data was also bearish for the pair, leading to a large fall at the end of the week.
Technical Picture
The 10-day moving average is now pointing lower again. Friday’s sharp fall also saw the market close below the lower Bollinger Band, showing strong downside pressure.
Outlook This Week
EUR/USD looks oversold in the short term, so it may be difficult to sell at current levels. Waiting for a rebound and then looking to sell may be the better strategy in the short to medium term.
Unleash your trading potential on Fintokei accounts too!
Equities
U.S. Stock Market
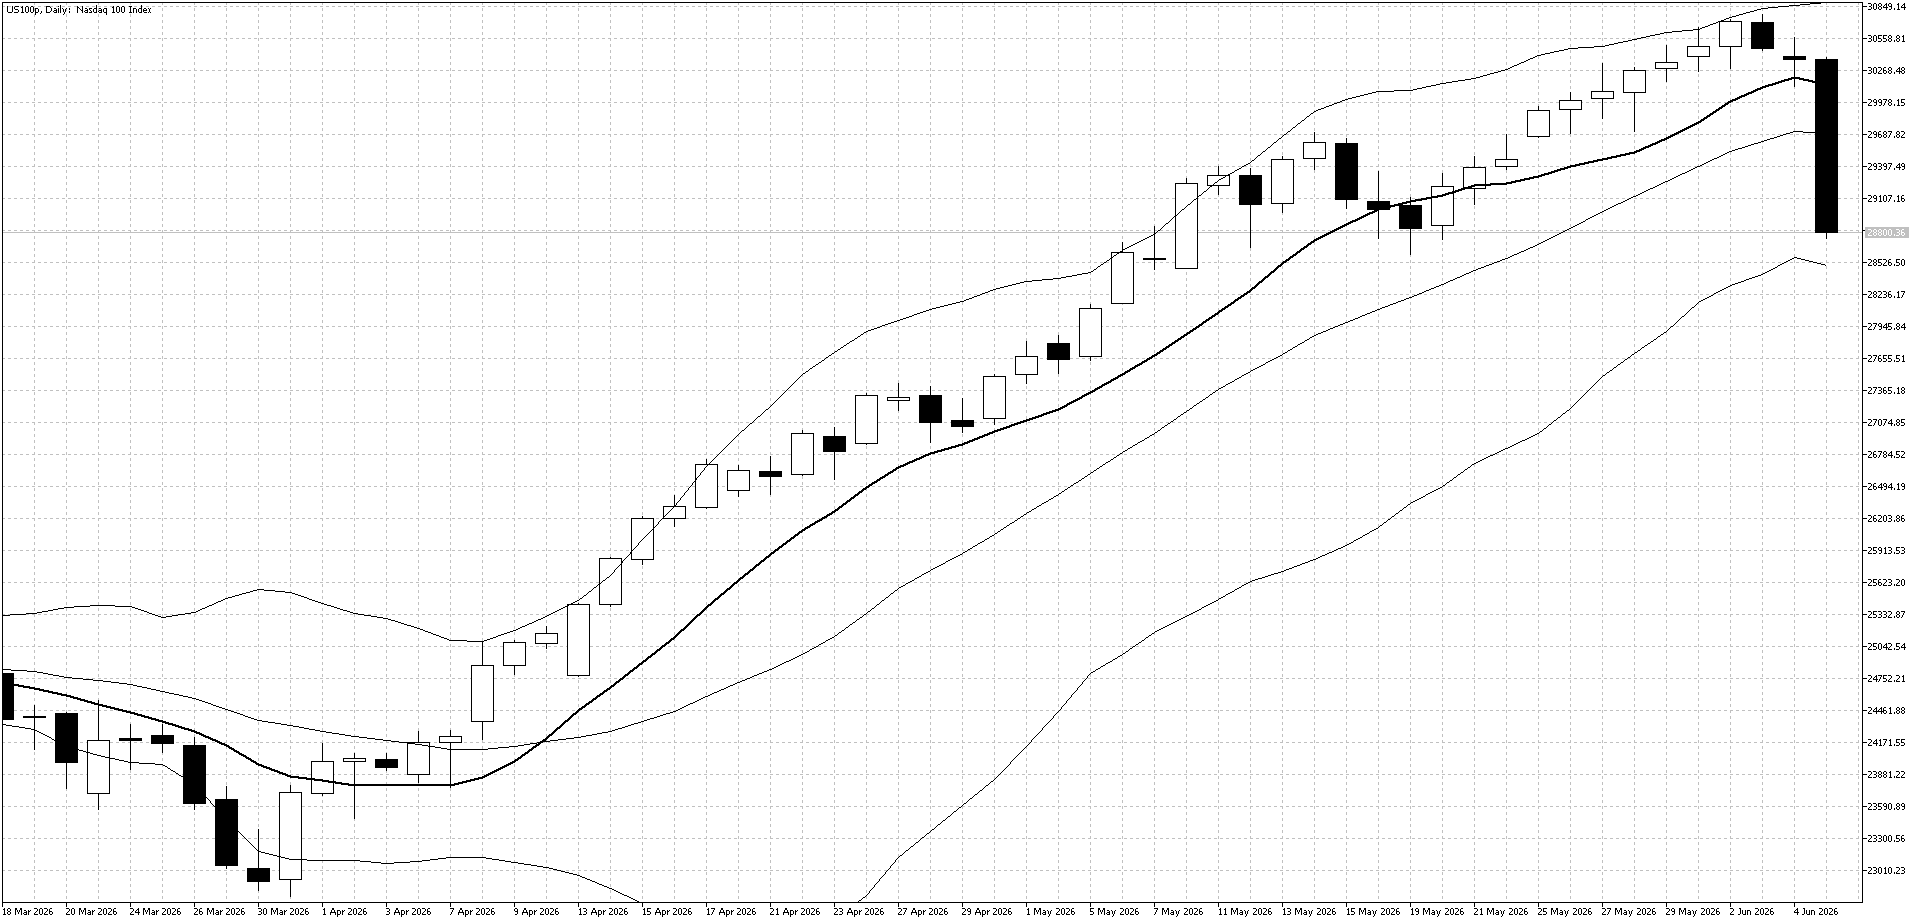
Last Week Recap
Concerns about high valuations in technology stocks triggered selling in the Nasdaq in the middle of last week. After stronger-than-expected U.S. employment data, the market fell more than 4% on Friday, as fears of higher U.S. interest rates weighed on sentiment.
Technical Picture
The market had been in a long uptrend, but that trend has now been broken. The large fall pushed prices down toward the lower Bollinger Band, showing strong short-term selling pressure.
Outlook This Week
In the short term, the market may find some support and could see a quick rebound at the start of the week. However, traders will be watching the important U.S. inflation data later in the week, which could decide whether this is only a short-term pullback or the start of a larger downtrend.
Take advantage of zero commissions on oil and indices – start today!
Commodities
Gold
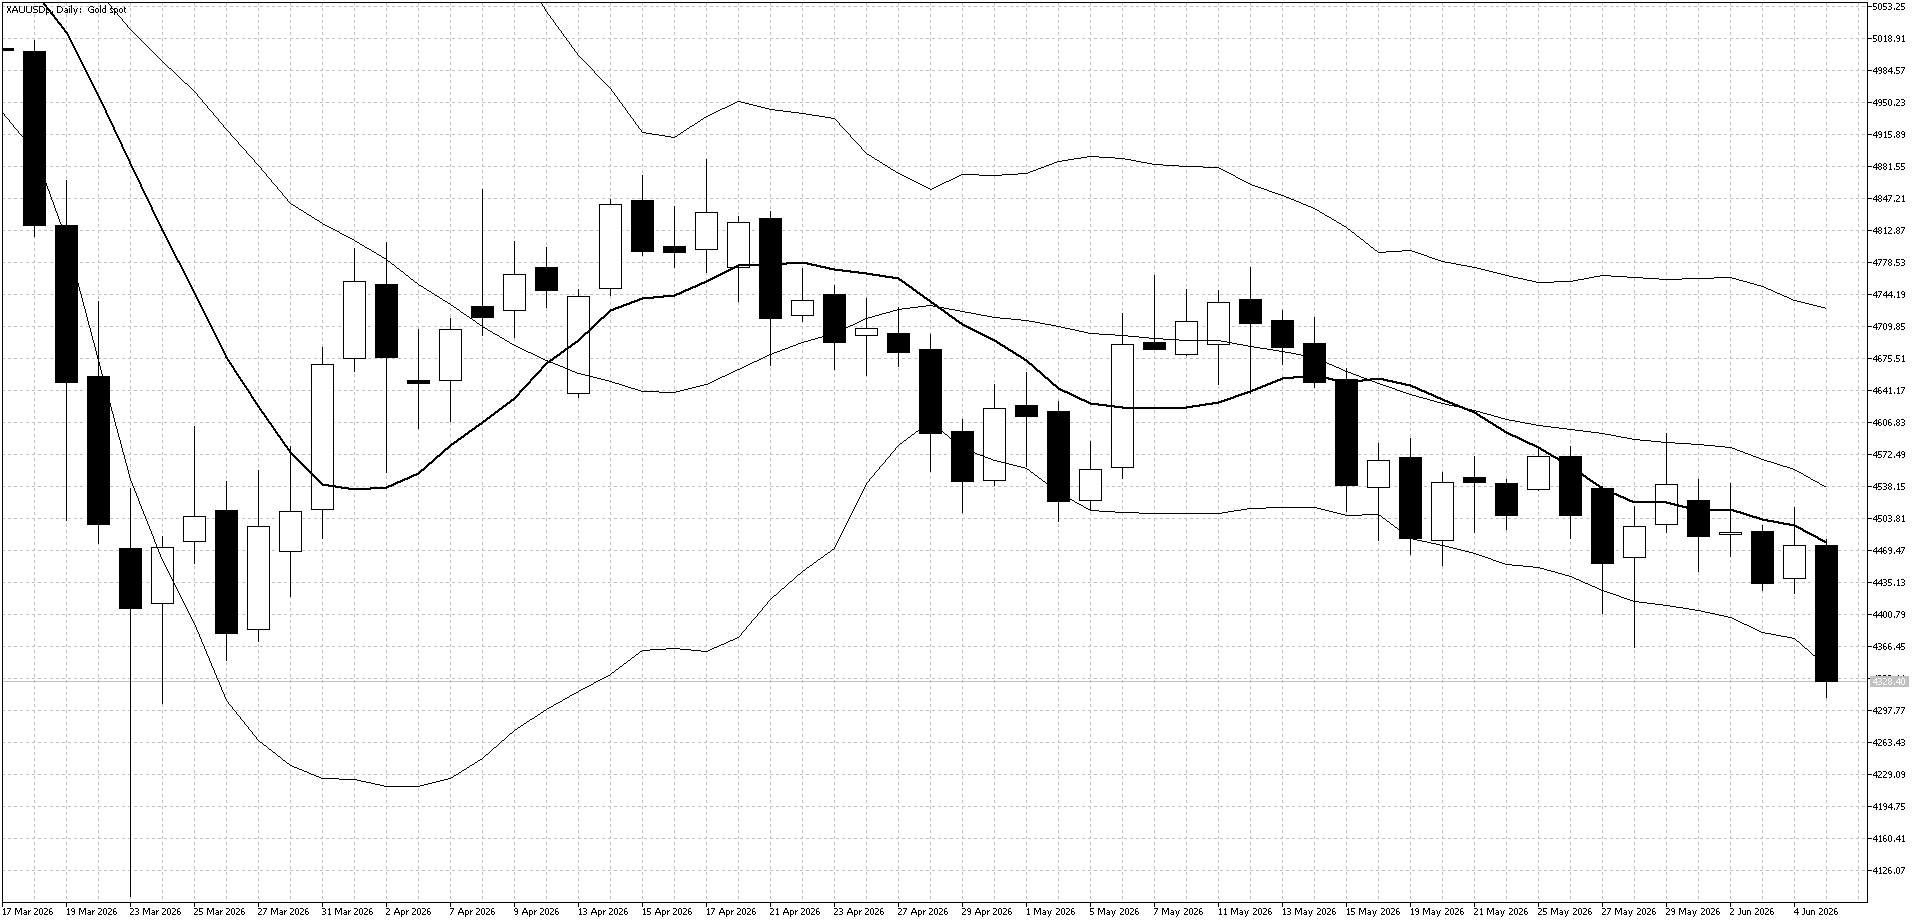
Last Week Recap
Gold came under pressure again last week as rising crude oil prices at the start of the week supported the U.S. dollar. Strong U.S. employment data then increased expectations of possible U.S. rate hikes, causing gold to fall sharply into the end of the week.
Technical Picture
The weekly close below the May lows and below the lower Bollinger Band is a bearish medium-term signal. The 10-day moving average is also acting as resistance again.
Outlook This Week
Central bank buying remains supportive, so short-term day traders may find buying opportunities if gold starts to recover at the beginning of the week. However, medium-term traders may prefer to wait for further weakness before looking to buy.
Volatility could stay high this week after the strong U.S. employment data. Traders will be watching U.S. CPI and PPI closely, as stronger inflation could increase expectations for another Fed rate hike. The ECB interest rate decision will also be important.
Ready to try the best one-step prop challenge?
Start your SwiftTrader challenge today and trade toward your first payout.
