
Market Sector Scanner: Middle East Tensions, Yen Intervention and the ECB
Weaker U.S. inflation reduced expectations of an early Fed rate hike last week, while rising U.S.–Iran tensions pushed oil prices higher, weakened the yen and supported USD/JPY. U.S. and Japanese stocks fell as concerns about expensive AI shares and stronger Chinese competition returned. This week, markets will focus on Middle East developments, possible action by Japan to limit further yen weakness and the ECB meeting. USD/JPY, GBP/JPY, EUR/USD and gold may offer range-trading opportunities, while the Nasdaq could remain under pressure.

Markets reacted to weaker U.S. inflation data and rising U.S.–Iran tensions. Lower inflation reduced expectations of a near-term Fed rate hike. WTI crude oil rose sharply on fears of disruption in the Strait of Hormuz, weakening the yen and pushing USD/JPY higher. U.S. and Japanese stocks fell on concerns about high AI valuations, with Moonshot AI's Kimi K3 model adding to worries about stronger competition.
Key Events Calendar
Jump to: Forex Market | Equities | Commodities
Market Outlook
Forex Market
USD/JPY
Last Week Recap
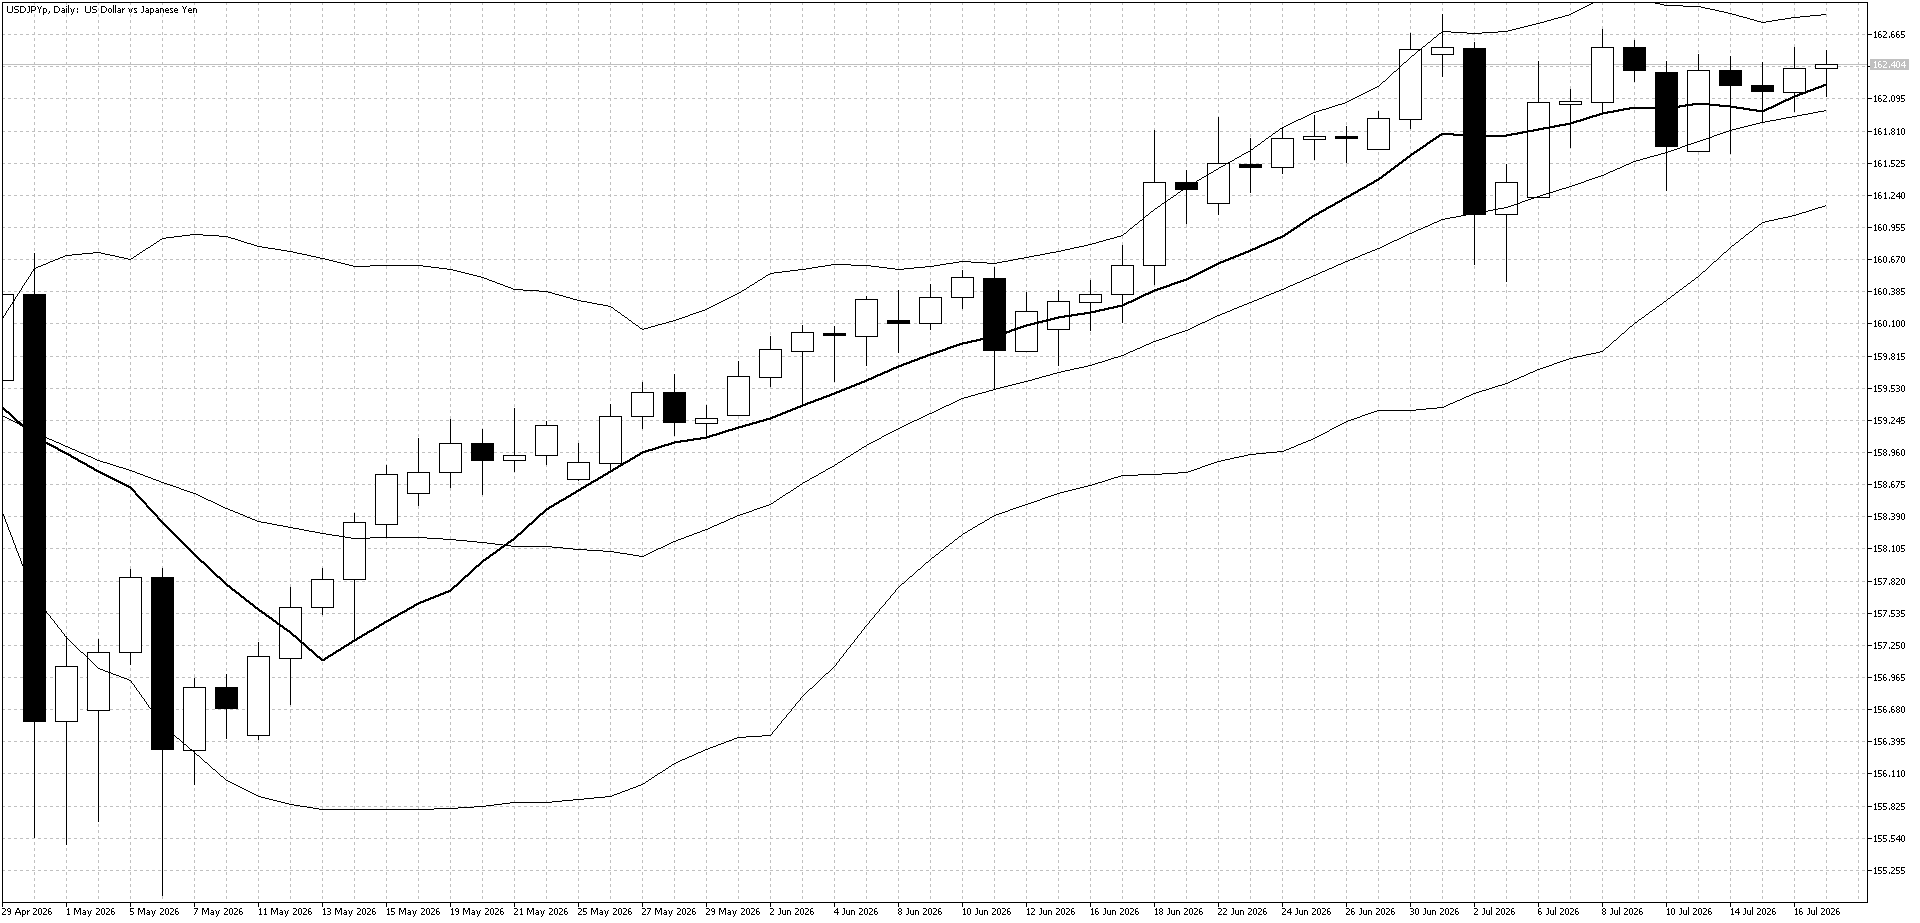
Despite weaker-than-expected U.S. inflation data, USD/JPY continued to move higher and test recent resistance. Rising crude oil prices weakened the yen, while the large interest-rate gap between the U.S. and Japan continued to support demand for the dollar.
Technical Picture
The market remains in an uptrend, with the 10-day moving average pointing slightly higher. However, strong resistance around 163, the recent highs, and the upper Bollinger Band has kept the pair within a range.
Outlook This Week
Although the uptrend remains in place, buying at current levels is difficult with resistance nearby. Range trading may be the preferred strategy for now. Medium-term traders may look for a selling opportunity if the Bank of Japan intervenes or Japanese officials take a more aggressive stance against further yen weakness.
GBP/JPY
Last Week Recap
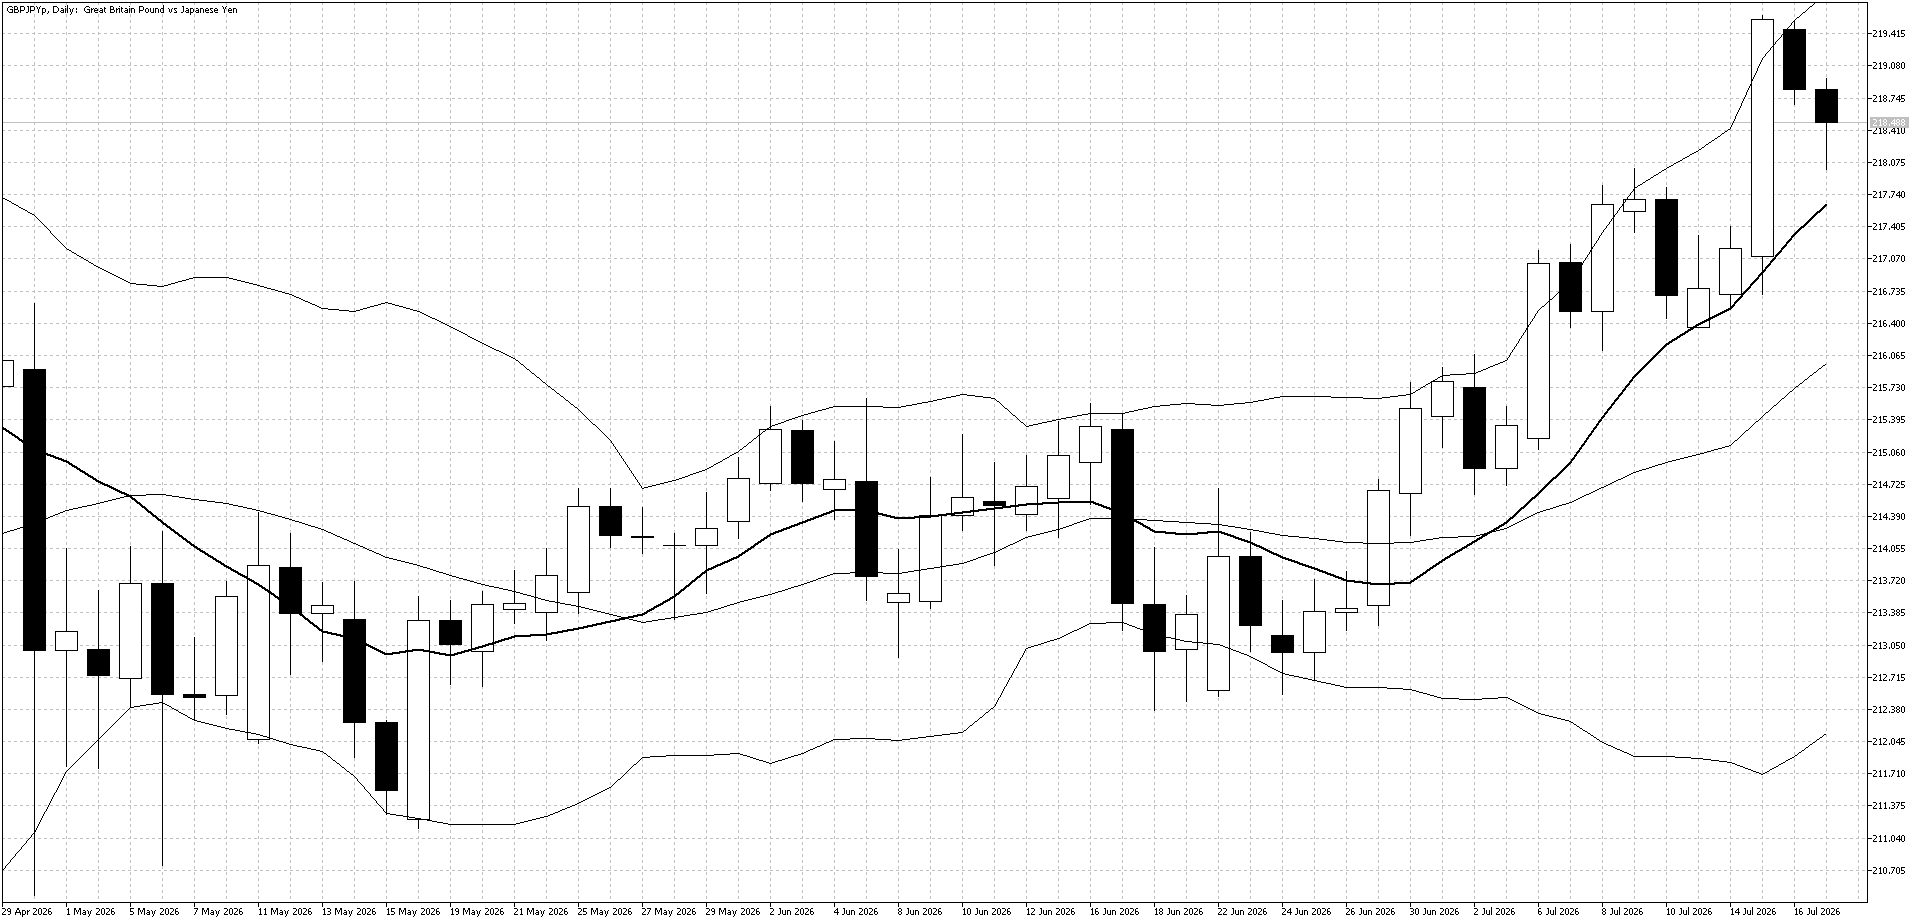
GBP/JPY rose to its highest level since 2007, supported by weaker-than-expected U.S. inflation data and stronger-than-expected U.K. GDP figures.
Technical Picture
The uptrend remains strong, with the 10-day moving average clearly pointing higher. However, the upper Bollinger Band triggered a sell signal toward the end of the week as the market became overbought.
Outlook This Week
Concerns about the possible negative impact of the new U.K. prime minister have not materialized so far. In the short term, traders may continue to follow the uptrend and look to buy weakness around the 10-day moving average.
EUR/USD
Last Week Recap
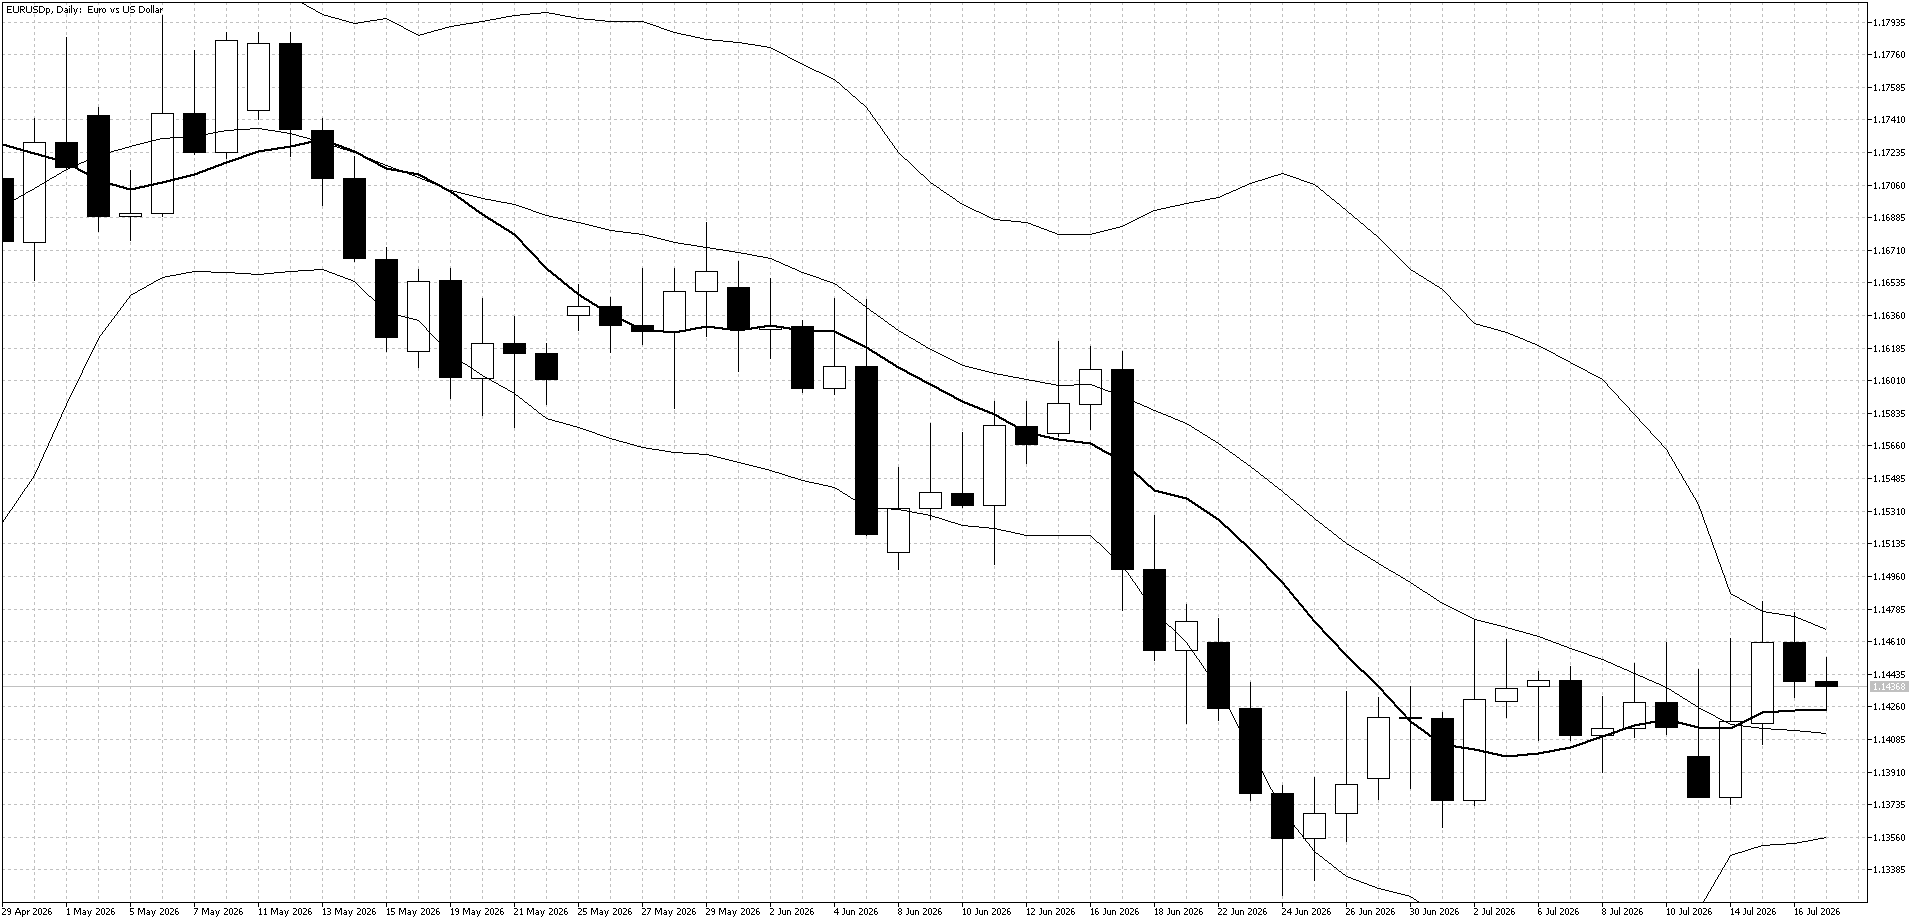
EUR/USD remained relatively quiet and moved slightly higher following weaker-than-expected U.S. CPI data. Eurozone inflation came in at around 3%, which remains elevated and may encourage the ECB to consider raising interest rates toward the end of the year.
Technical Picture
The Bollinger Bands have narrowed considerably, while the 10-day moving average is pointing sideways. This suggests range-trading conditions may continue in the short term.
Outlook This Week
EUR/USD may offer good range-trading opportunities this week, with the ECB widely expected to leave interest rates unchanged at its upcoming meeting.
Equities
U.S. Stock Market
Last Week Recap
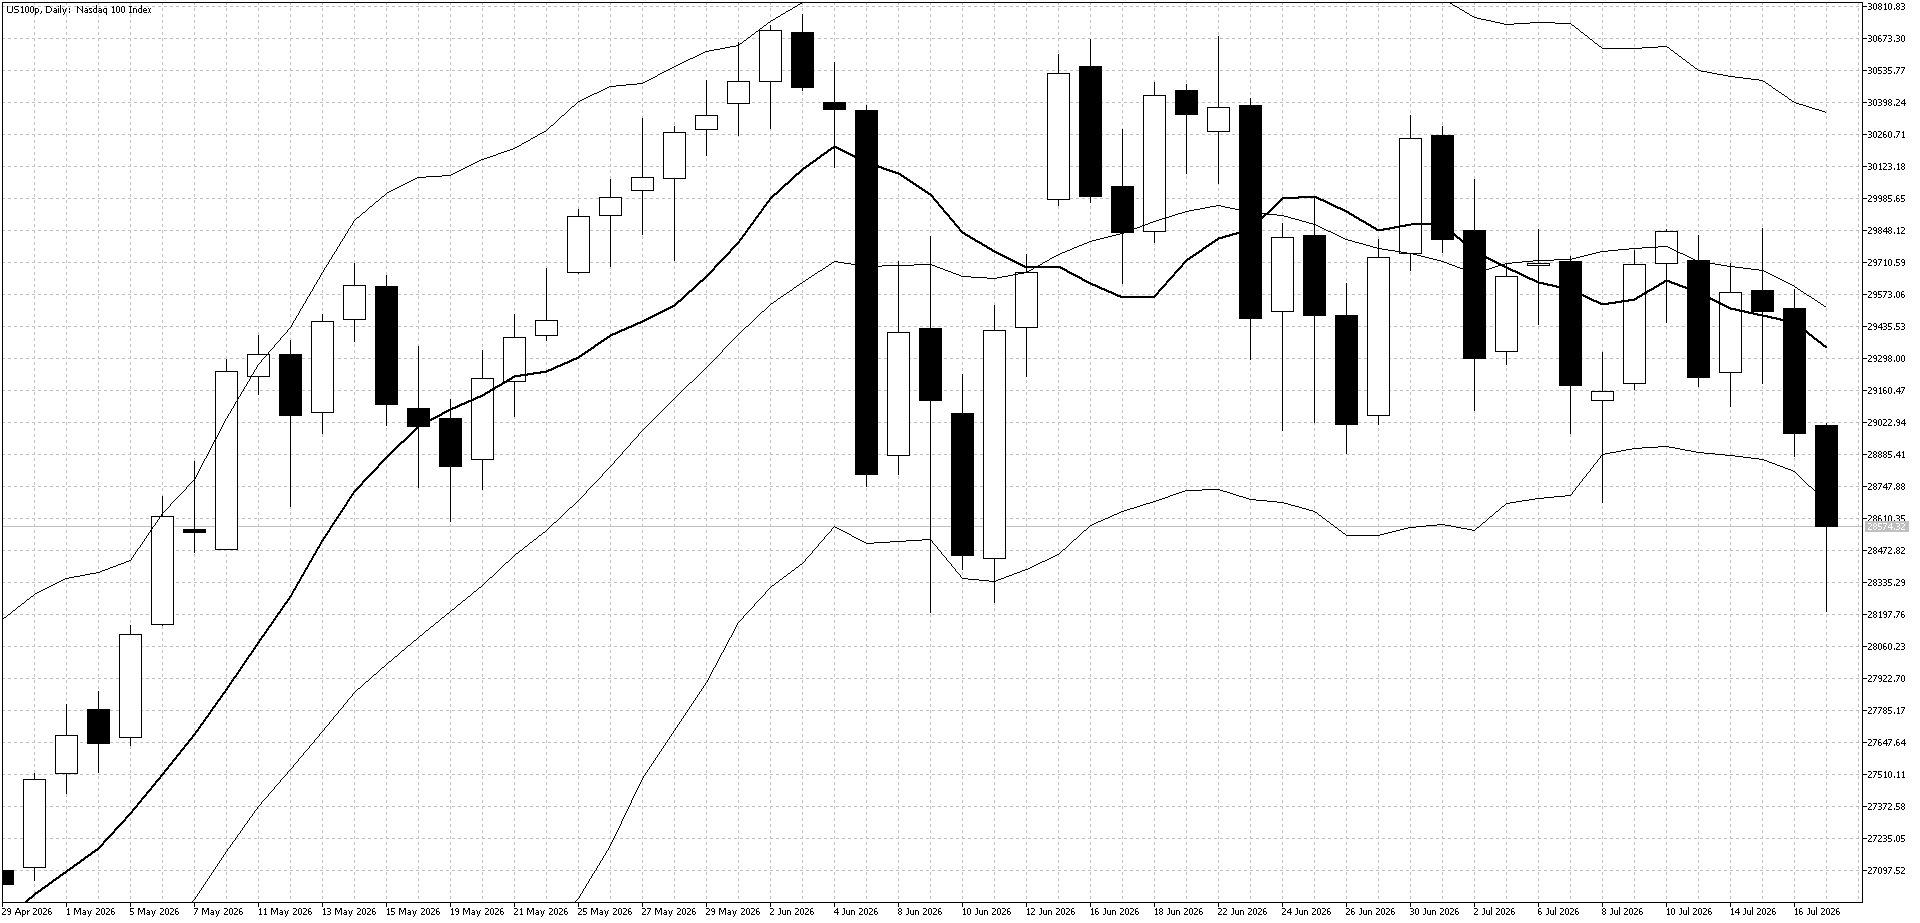
The release of a new open-source AI model from China renewed concerns that AI-related stocks may be overvalued, causing the Nasdaq to fall last week.
Technical Picture
The index closed near its weekly low and below the lower Bollinger Band. With the 10-day moving average now pointing lower, this could signal the beginning of a new downtrend.
Outlook This Week
The Nasdaq has risen significantly over recent months and may now be entering a broader correction. Traders may therefore prefer to focus on selling opportunities this week, particularly if any rebound begins to lose momentum.
Commodities
Gold
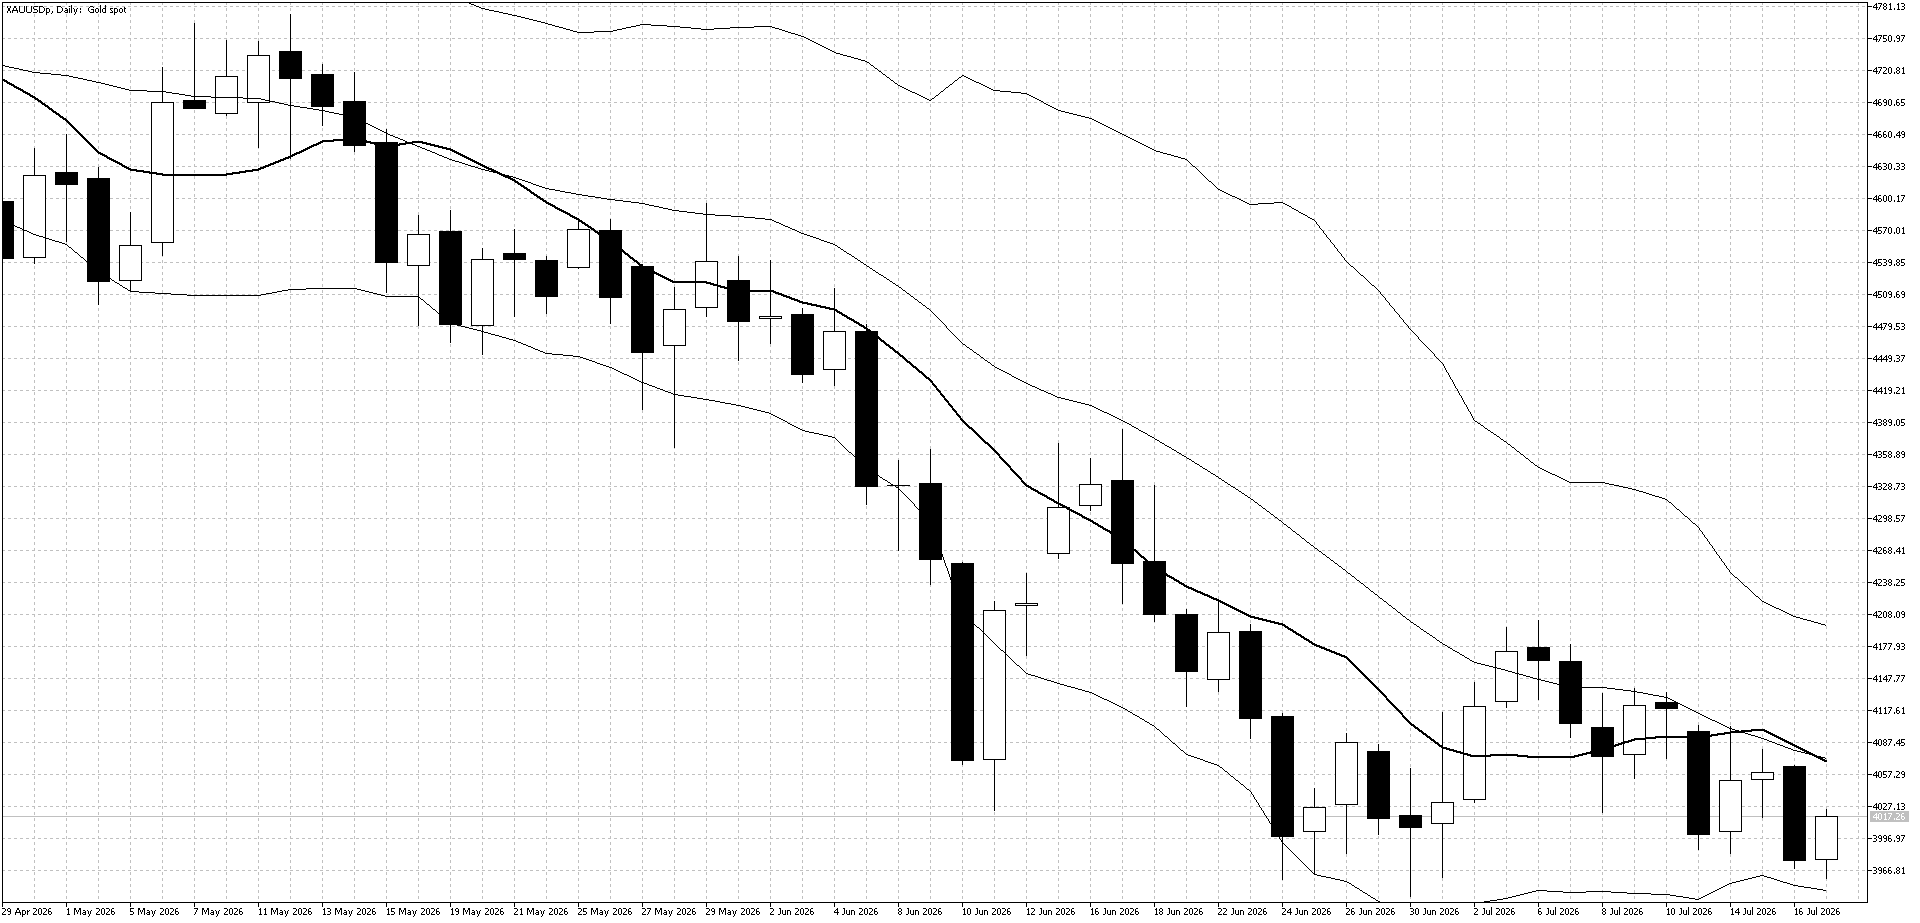
Last Week Recap
Gold tested its yearly lows several times last week as rising WTI crude oil prices encouraged selling. However, weaker-than-expected U.S. inflation data and reports of central bank buying helped prices recover and close the week back above $4,000.
Technical Picture
The lower Bollinger Band is close to the recent lows and may continue to act as support. However, with the 10-day moving average pointing lower, any recovery may struggle to gain strong momentum.
Outlook This Week
For medium-term traders, buying weakness alongside continued central bank demand may be the preferred strategy. Short-term traders may also find good range-trading opportunities while gold remains between support and resistance.
Take advantage of zero commissions on oil and indices – start today!
Markets will focus on Middle East developments, possible action to support the yen and the ECB meeting. Rates are expected to remain unchanged, but guidance on future increases will be closely watched.