Market Sector Scanner: Strong U.S. Data Continues to Support USD/JPY Near 162
Markets ended weaker as U.S. and Japanese stocks pulled back from record highs on AI valuation concerns. Strong U.S. data supported the dollar and pushed USD/JPY close to 162 without Bank of Japan intervention. This week, traders will watch U.S. employment data, yen intervention risk, gold’s recovery, and whether equities can hold near recent highs.

Markets ended the week on a weaker note after early strength in U.S. and Japanese equities faded. Concerns over AI stock valuations pressured sentiment, while SpaceX fell below its IPO price and finished more than 10% lower. The U.S. dollar remained firm as strong GDP and durable goods data, together with still-high Core PCE inflation, kept expectations alive for at least one more Fed rate hike this year. USD/JPY repeatedly tested the 162 area without Bank of Japan intervention, gold briefly dropped below $4,000 before recovering, Bitcoin stayed under pressure, and crude oil fell as traders watched negotiations over Middle East supply.
Key Events Calendar
Market Outlook
Forex Market
USD/JPY
Last Week Recap
Better-than-expected U.S. economic data and growing expectations for a U.S. interest rate increase later this year helped USD/JPY continue testing higher levels last week. The risk of Bank of Japan intervention remained, but resistance held around 162.
Technical Picture
The uptrend remains strong, with the 10-day moving average still pointing higher. However, the upper Bollinger Band and the 162 level acted as resistance, showing that buyers are becoming more cautious at these levels.
Outlook This Week
The uptrend remains intact, so buying on weakness may still work in the short term. However, if resistance around 162 continues to hold, or if USD/JPY breaks below the 10-day moving average, it could create a short-term selling opportunity.
GBP/JPY
Last Week Recap
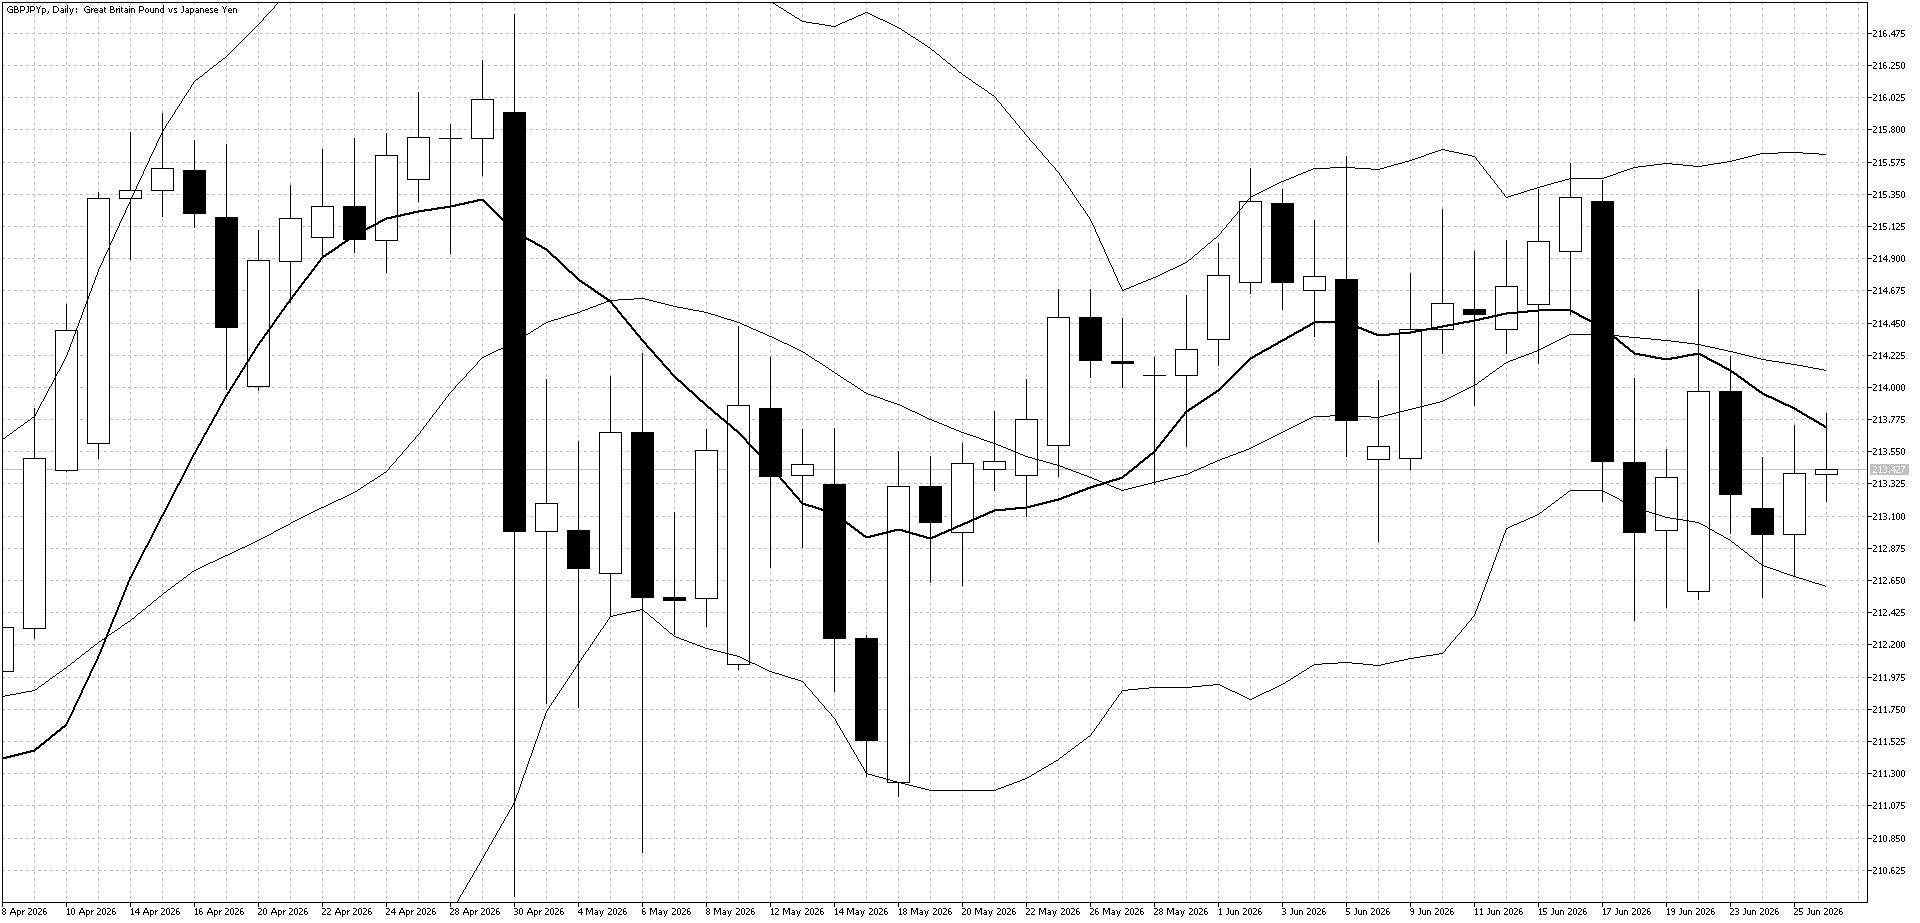
GBP/JPY ended the week close to unchanged despite further yen weakness. The resignation of the U.K. Prime Minister and weaker-than-expected U.K. economic data weighed on the pound and limited gains in the pair.
Technical Picture
The recovery remained weak last week, with the downward-pointing 10-day moving average continuing to limit upside momentum. This suggests that GBP/JPY may struggle to build a stronger rebound in the short term.
Outlook This Week
Sideways to lower price action looks most likely this week as markets assess the possible negative impact of political uncertainty and a new U.K. Prime Minister on the U.K. economy.
EUR/USD
Last Week Recap
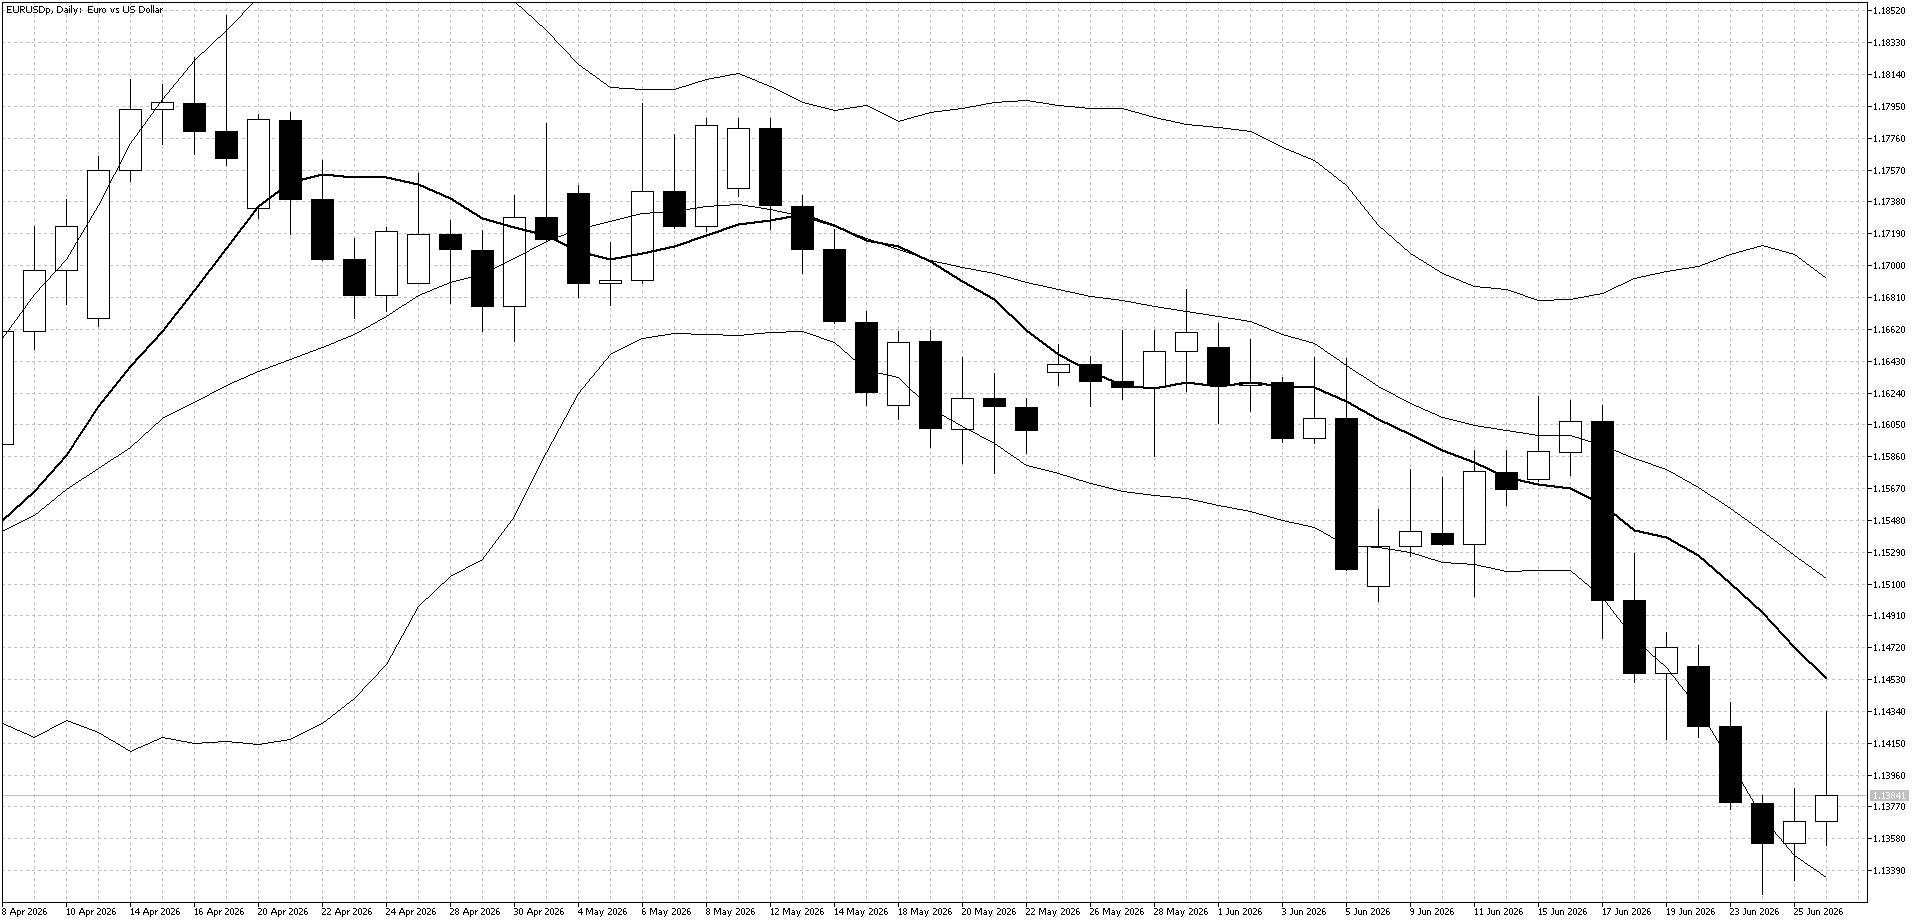
Selling continued in EUR/USD last week as stronger U.S. economic data widened the gap between the U.S. and Europe, where economic data remained weak. This supported expectations for higher U.S. interest rates and pushed EUR/USD to new lows for the year.
Technical Picture
The lower Bollinger Band triggered a short-term buy entry toward the end of the week, but the recovery was stopped by the bearish 10-day moving average. This shows that sellers remain in control and that any rebound may face resistance quickly.
Outlook This Week
The technical and fundamental outlook remains negative for EUR/USD, so focusing on selling opportunities looks like the better approach this week. A rebound toward the 10-day moving average could provide a better level to look for sell entries.
Equities
U.S. Stock Market
Last Week Recap
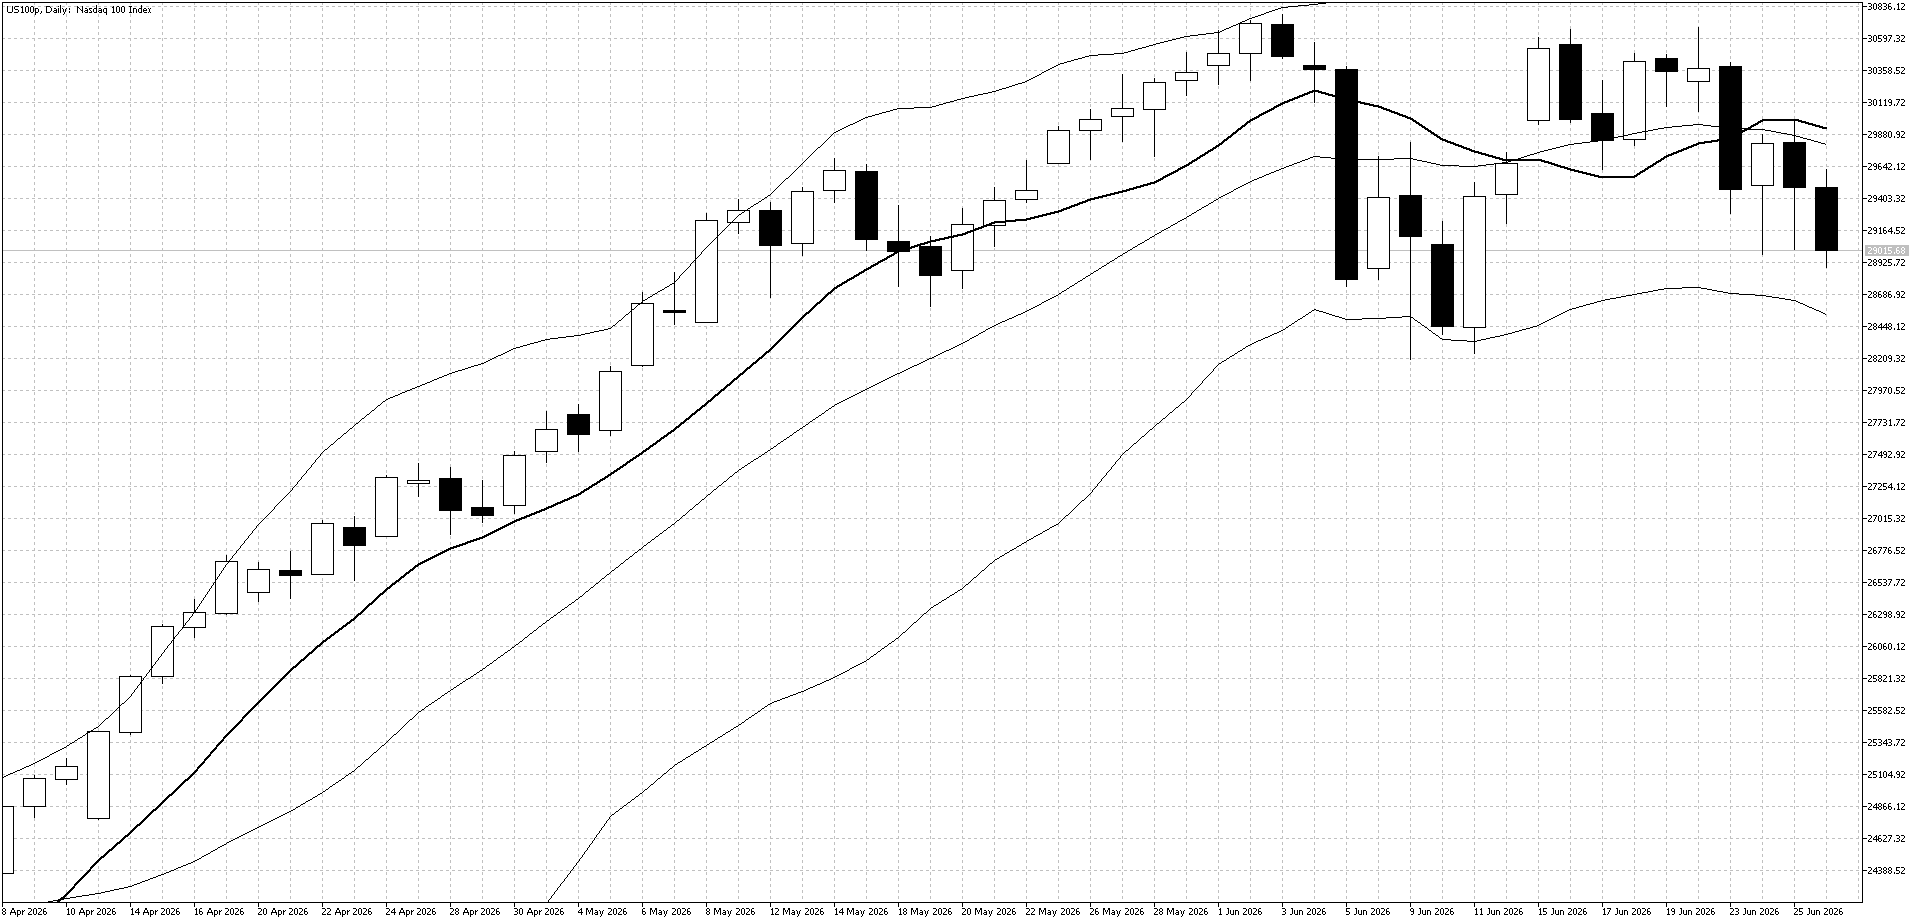
The Nasdaq failed to break above its record highs again last week as concerns over AI company valuations continued to weigh on sentiment. Expectations for a possible rise in U.S. interest rates later this year also added pressure, as higher rates could reduce demand for growth stocks.
Technical Picture
The 10-day moving average is still pointing sideways, while the lower Bollinger Band remains nearby. This suggests that range trading conditions are still in place, but downside pressure is starting to increase.
Outlook This Week
The risk of a larger sell-off is rising after the market failed to make new highs. For now, looking to sell into strength may be the better strategy in the coming week.
Commodities
Gold
Last Week Recap
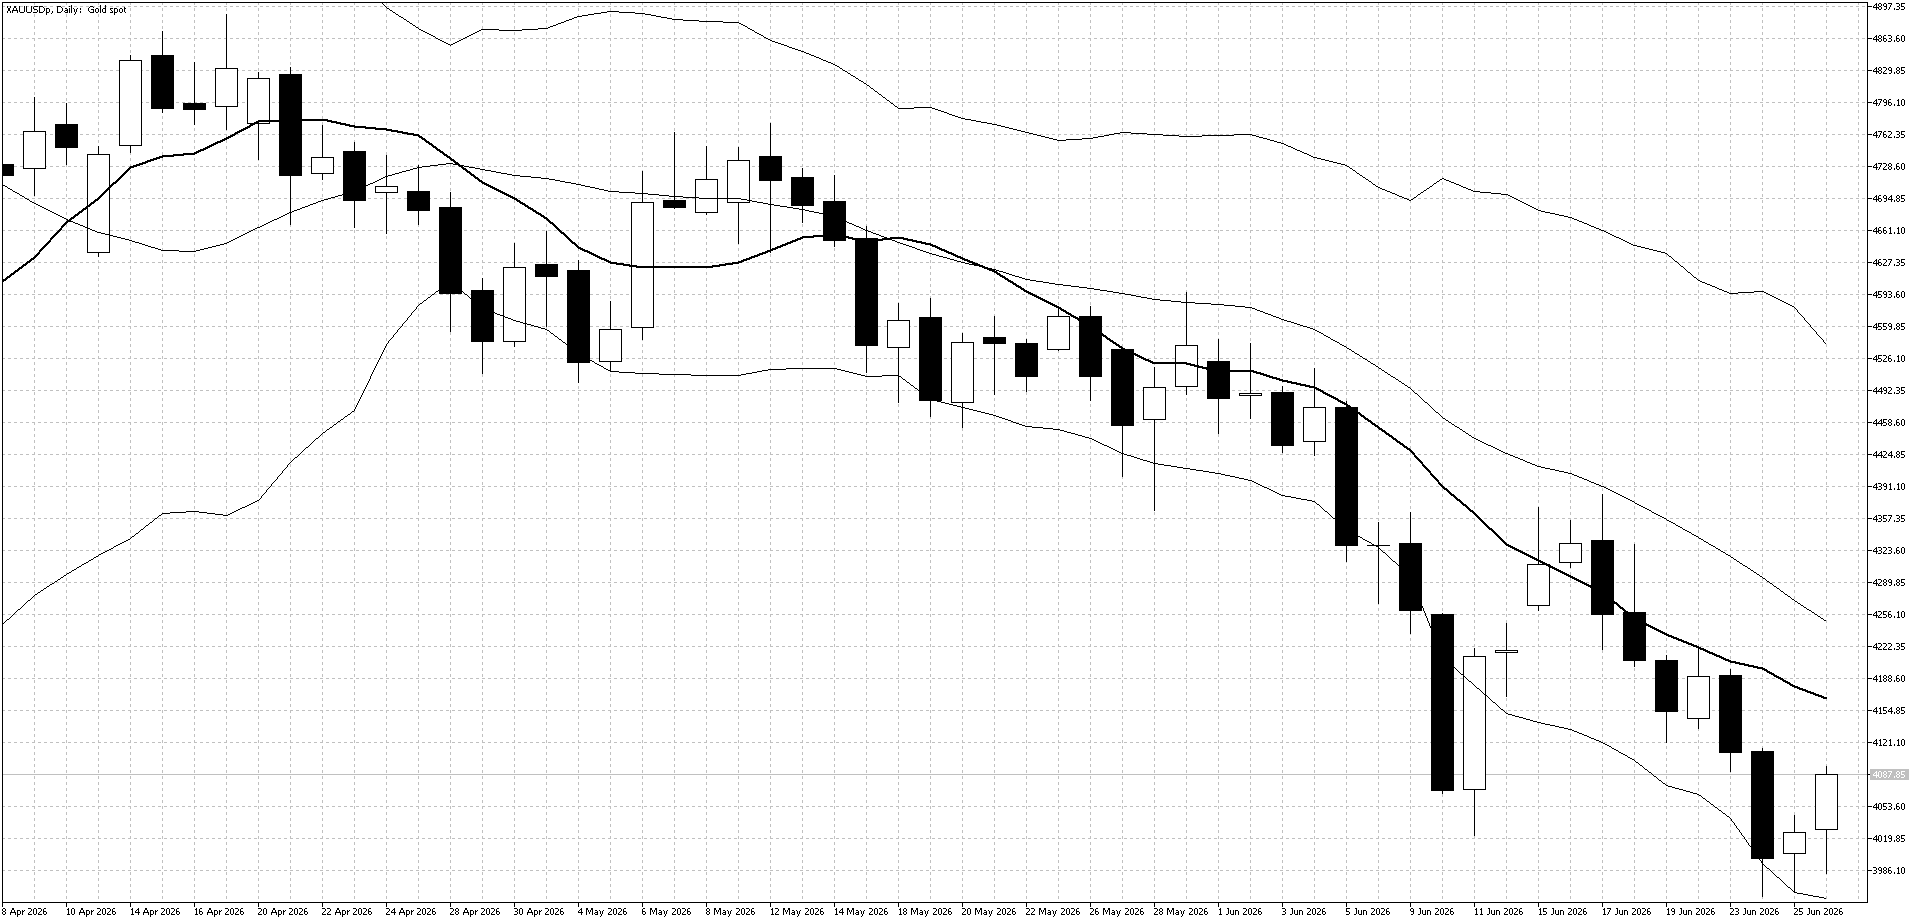
Gold broke below the $4,000 level last week as markets began pricing in the possibility of a U.S. interest rate increase later this year. Prices recovered toward the end of the week, helped by expectations that central banks may continue buying gold at lower levels.
Technical Picture
The downtrend remains strong, with the 10-day moving average recently acting as resistance. However, the move below $4,000 was short-lived, as the lower Bollinger Band triggered a short-term buy entry toward the end of the week.
Outlook This Week
The recovery back above $4,000 is encouraging, but the risk of higher U.S. interest rates and the downward-pointing 10-day moving average continue to pressure gold. As long as prices stay below the 10-day moving average, focusing on selling into strength looks like the better strategy this week.
Take advantage of zero commissions on oil and indices – start today!
Gold will be watched to see if it can recover, while crude oil prices will also remain in focus as traders look for a further decline as Middle East tensions ease. Equity markets are at an important point, with investors watching whether recent highs can hold or whether concerns about AI valuations create more selling pressure. It will be a shortened week because of Friday's U.S. Independence Day holiday, making Thursday's U.S. employment data the key event for markets.