
Market Sector Scanner: U.S. Inflation Data and Market Momentum
Markets face another busy week as investors focus on U.S. CPI and PPI inflation data, which could have a major impact across stocks, currencies, commodities, and cryptocurrencies. Traders will also monitor U.S.–Iran talks, developments around the Strait of Hormuz, and whether Japanese authorities carry out any further currency intervention after last week's joint action with the United States.

Reports that the Strait of Hormuz could reopen improved market sentiment and pushed oil prices lower. The Dow Jones Index reached new record highs as strong corporate earnings and continued enthusiasm for AI-related stocks supported investor confidence. Gold moved higher after U.S. employment data showed employers cut 23,000 jobs in July, far weaker than expected, increasing concerns that the U.S. economy is slowing. The United States and Japan also confirmed they had carried out their first coordinated currency intervention in 15 years to support the Japanese yen, while Japan approved a temporary cut in the consumption tax on food to help ease the impact of rising living costs.
Key Events Calendar
Jump to: Forex Market | Equities | Commodities
Market Outlook
Forex Market
USD/JPY
Last Week Recap
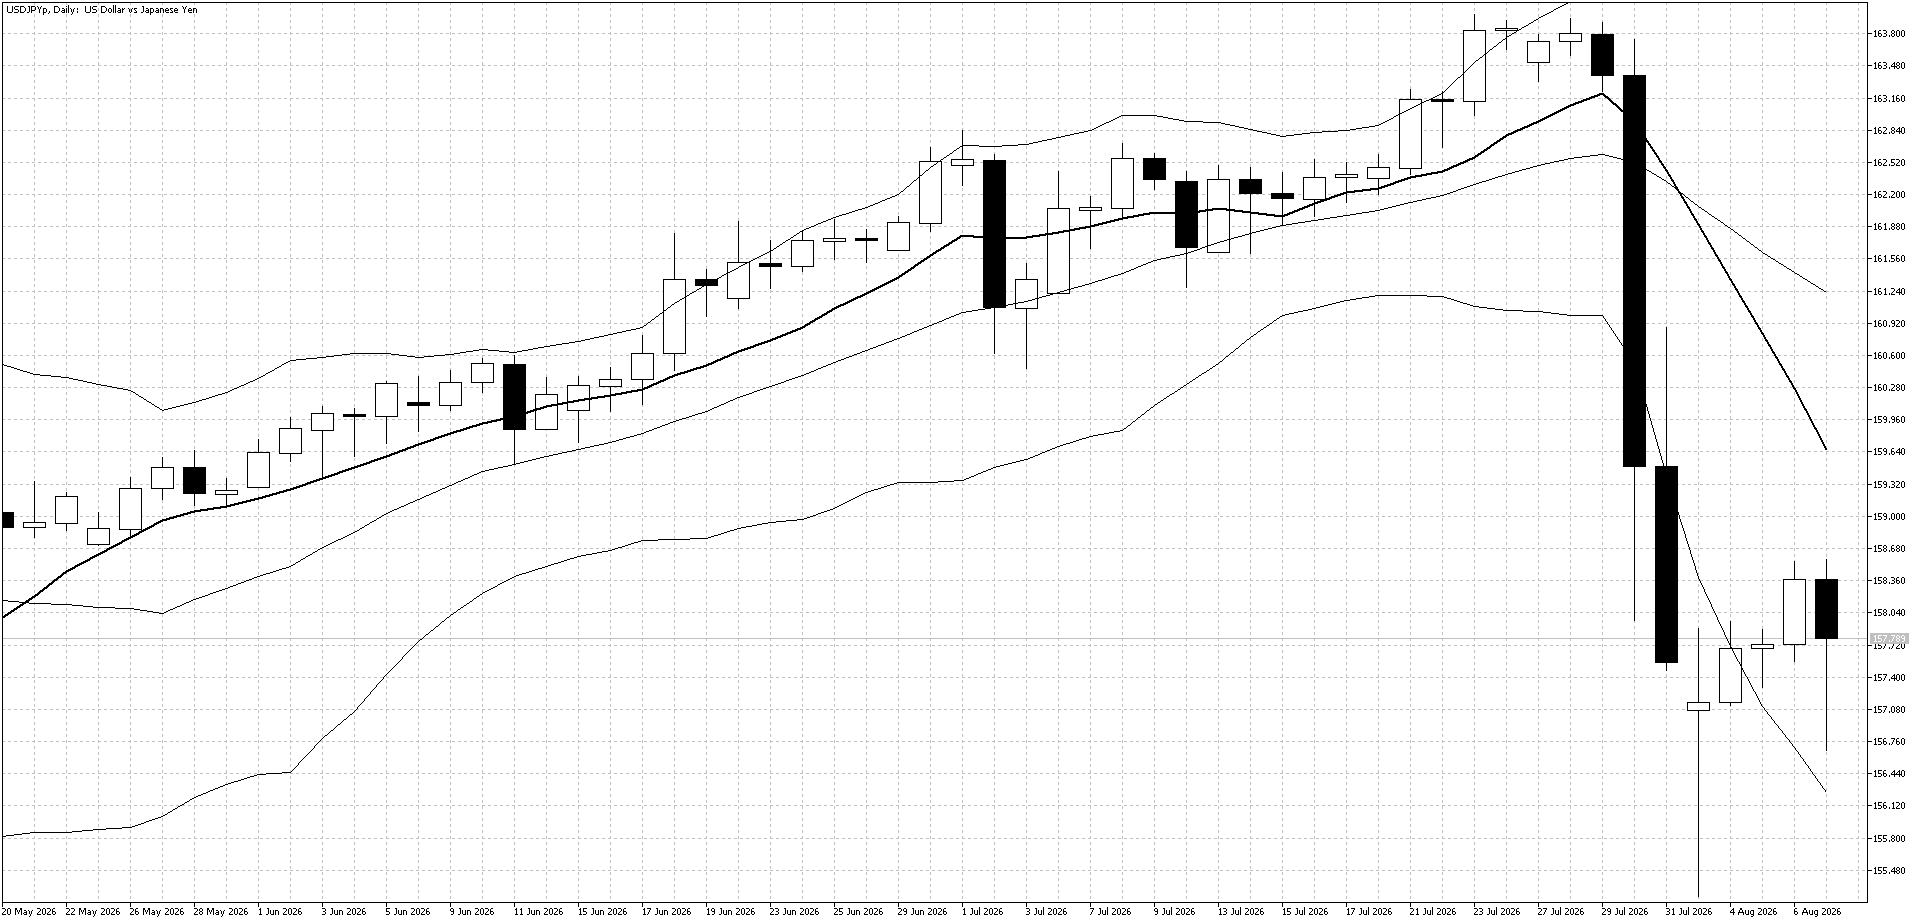
USD/JPY fell sharply at the start of last week after the United States and Japan confirmed they had carried out a joint currency intervention to support the Japanese yen. The pair recovered during the rest of the week as traders focused again on the large interest rate difference between the U.S. and Japan, which continues to support USD/JPY.
Technical Picture
USD/JPY has moved back above the lower Bollinger Band, and the gap between price and the 10-day moving average has become smaller. This shows the oversold conditions are starting to fade, although traders are still watching for any news about further intervention.
Outlook This Week
Buyers are returning to USD/JPY, and the pair could test the 10-day moving average this week. U.S. inflation data will be the main focus, as it could decide whether the recent downtrend continues or the market starts moving higher again.
Trade the news. No restrictions.
News trading is fully allowed at Fintokei. React to market-moving events your way.
GBP/JPY
Last Week Recap
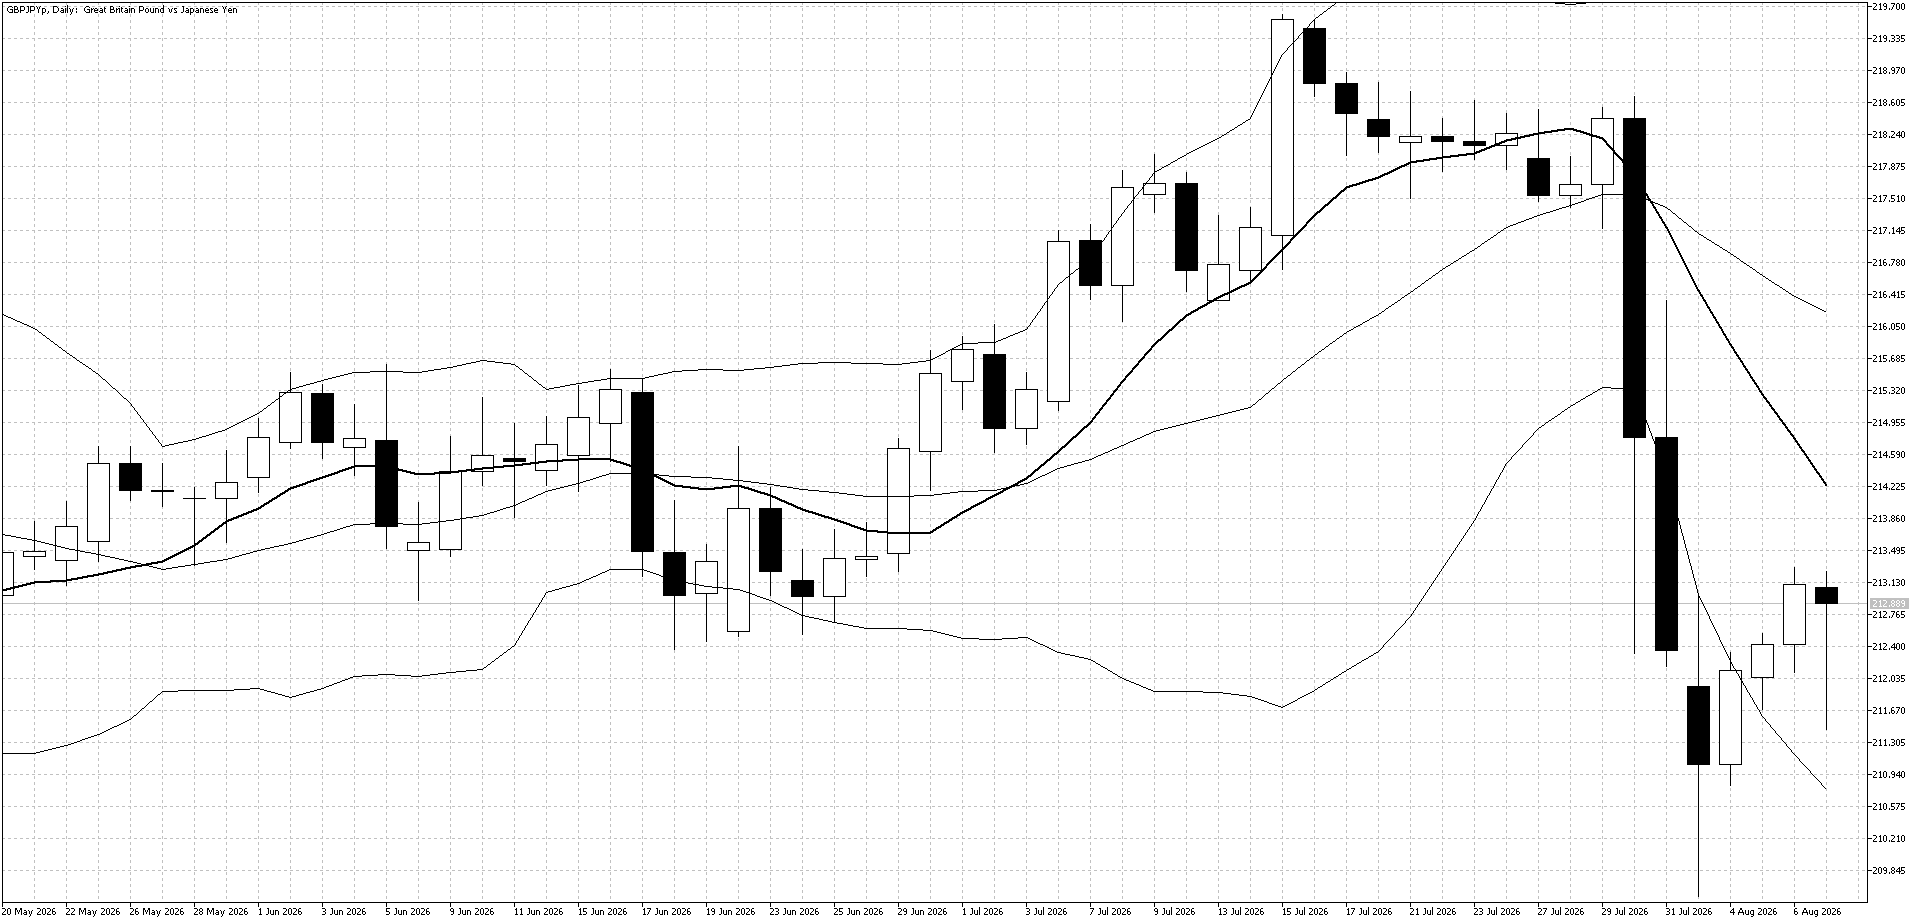
GBP/JPY moved largely in line with USD/JPY last week, as the Japanese yen remained the main driver following the recent currency intervention. The pair recovered through most of the week and finished higher.
Technical Picture
After starting the week in oversold territory, GBP/JPY moved back above the lower Bollinger Band. However, price is still below the falling 10-day moving average, suggesting the market remains slightly oversold in the short term.
Outlook This Week
The 10-day moving average will be the key level to watch this week. If it acts as resistance, the recent downtrend could continue. U.S. inflation data will also be important, with weaker-than-expected results likely to weigh on GBP/JPY. Before the data is released, the pair may continue to recover.
EUR/USD
Last Week Recap
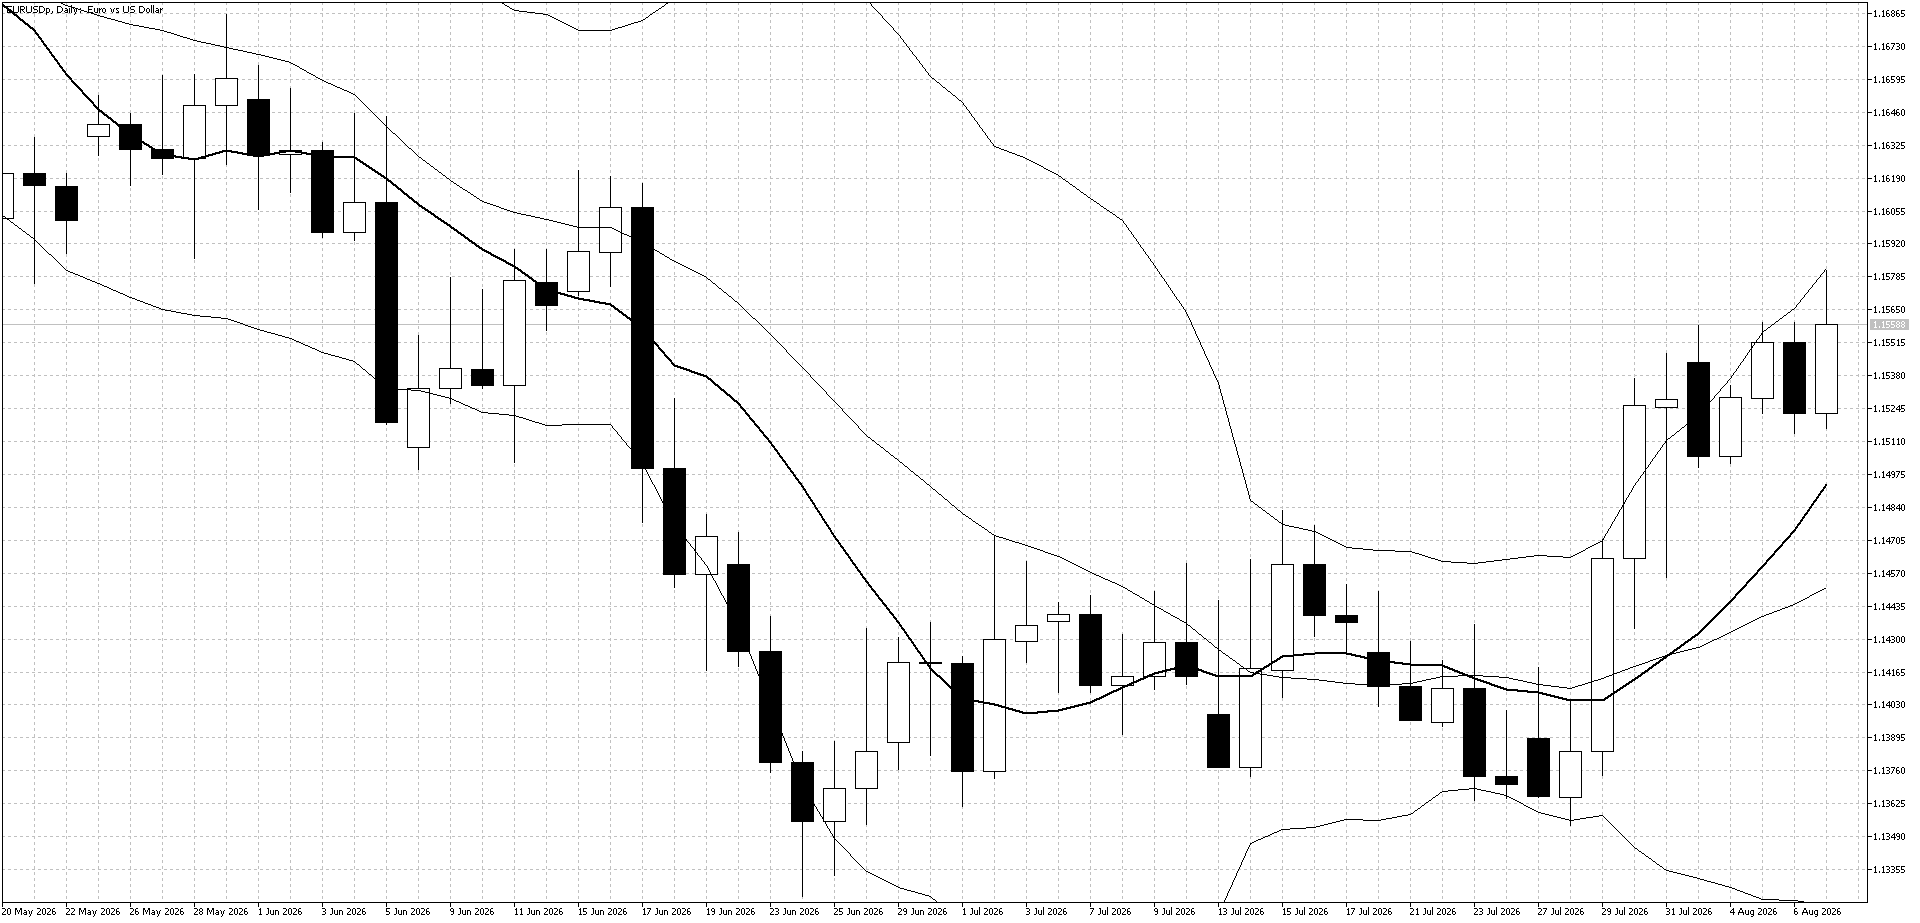
EUR/USD continued to rise last week as weak U.S. economic data weighed on the U.S. dollar. At the same time, Eurozone inflation data remained elevated, showing that inflation is still a concern.
Technical Picture
EUR/USD found resistance at the upper Bollinger Band last week, while the rising 10-day moving average continues to point to a strong uptrend.
Outlook This Week
The rising 10-day moving average could provide support if U.S. inflation data comes in lower than expected. At the start of the week, short-term traders may also find selling opportunities near resistance while waiting for the inflation data.
Equities
U.S. Stock Market
Last Week Recap
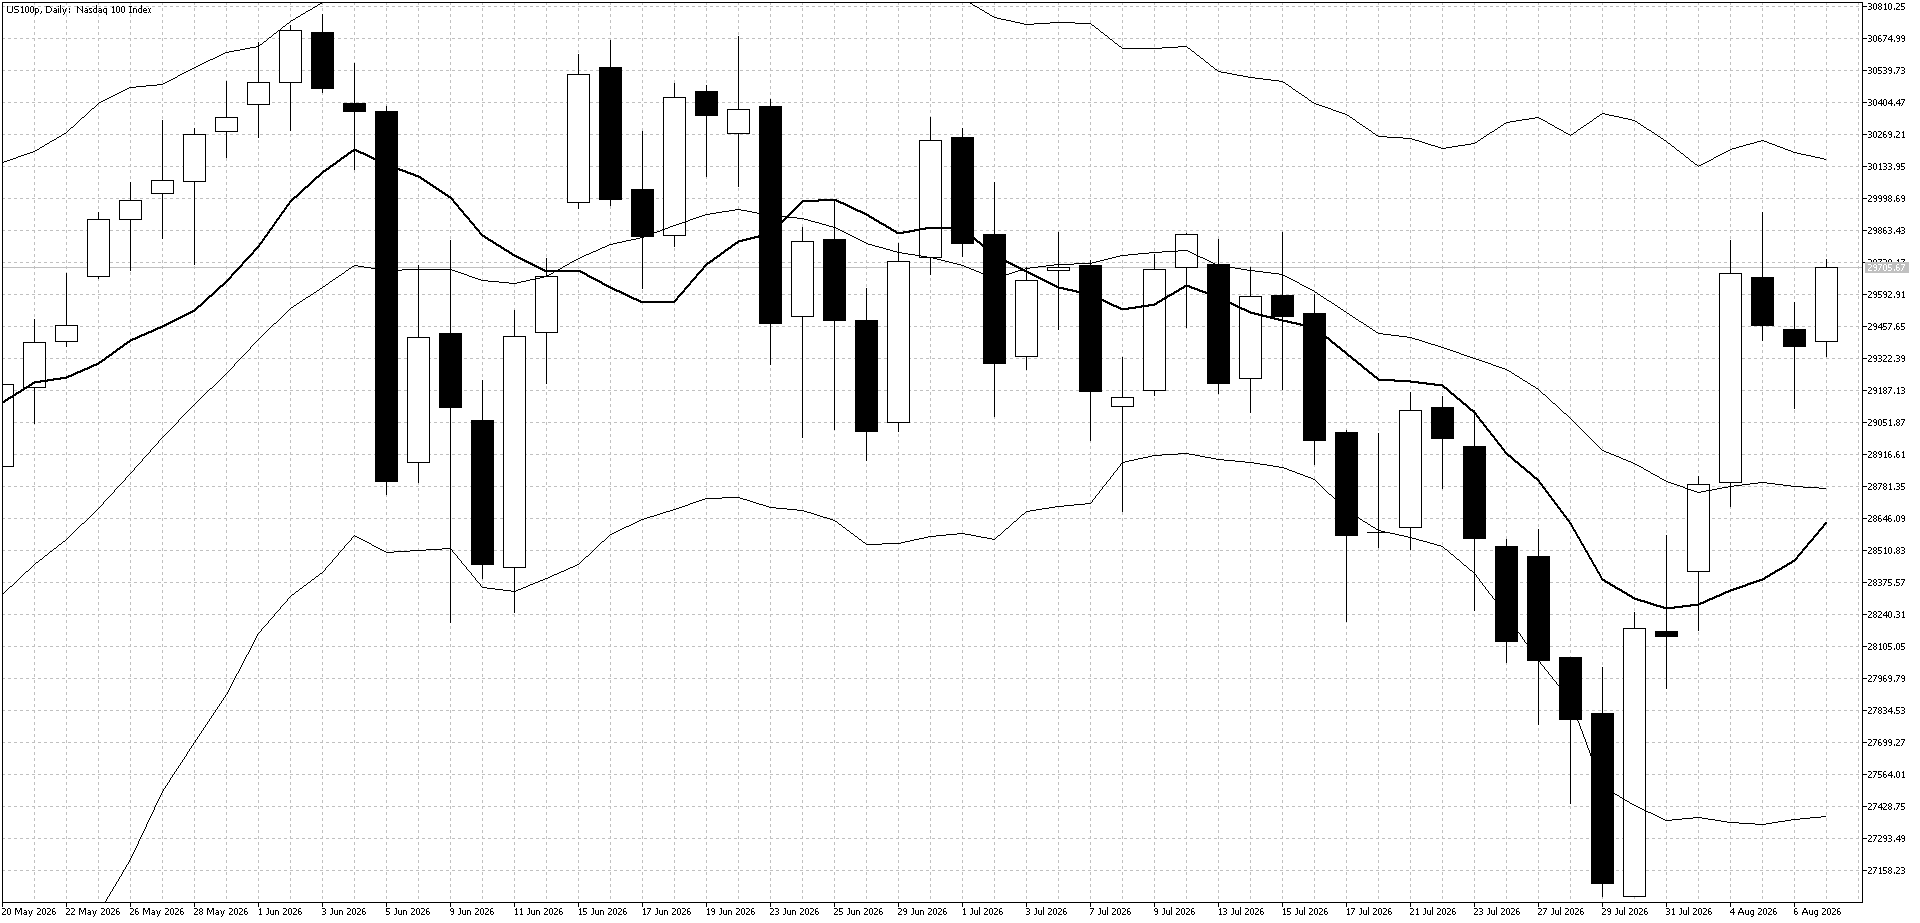
The Nasdaq rose nearly 5% last week as investors returned to AI-related stocks. Strong company earnings and lower oil prices also helped improve market sentiment and supported the rally.
Technical Picture
The strong move higher has broken the downtrend from the past month. The 10-day moving average is starting to turn higher, showing that the trend is improving. The upper Bollinger Band is now close and could act as resistance in the short term.
Outlook This Week
The recent downtrend has ended, but the Nasdaq is still trading in a range. If the market cannot break above resistance, selling near higher levels may be the better strategy this week. U.S. inflation data will also be important and could decide the market's next move.
Commodities
Gold
Last Week Recap
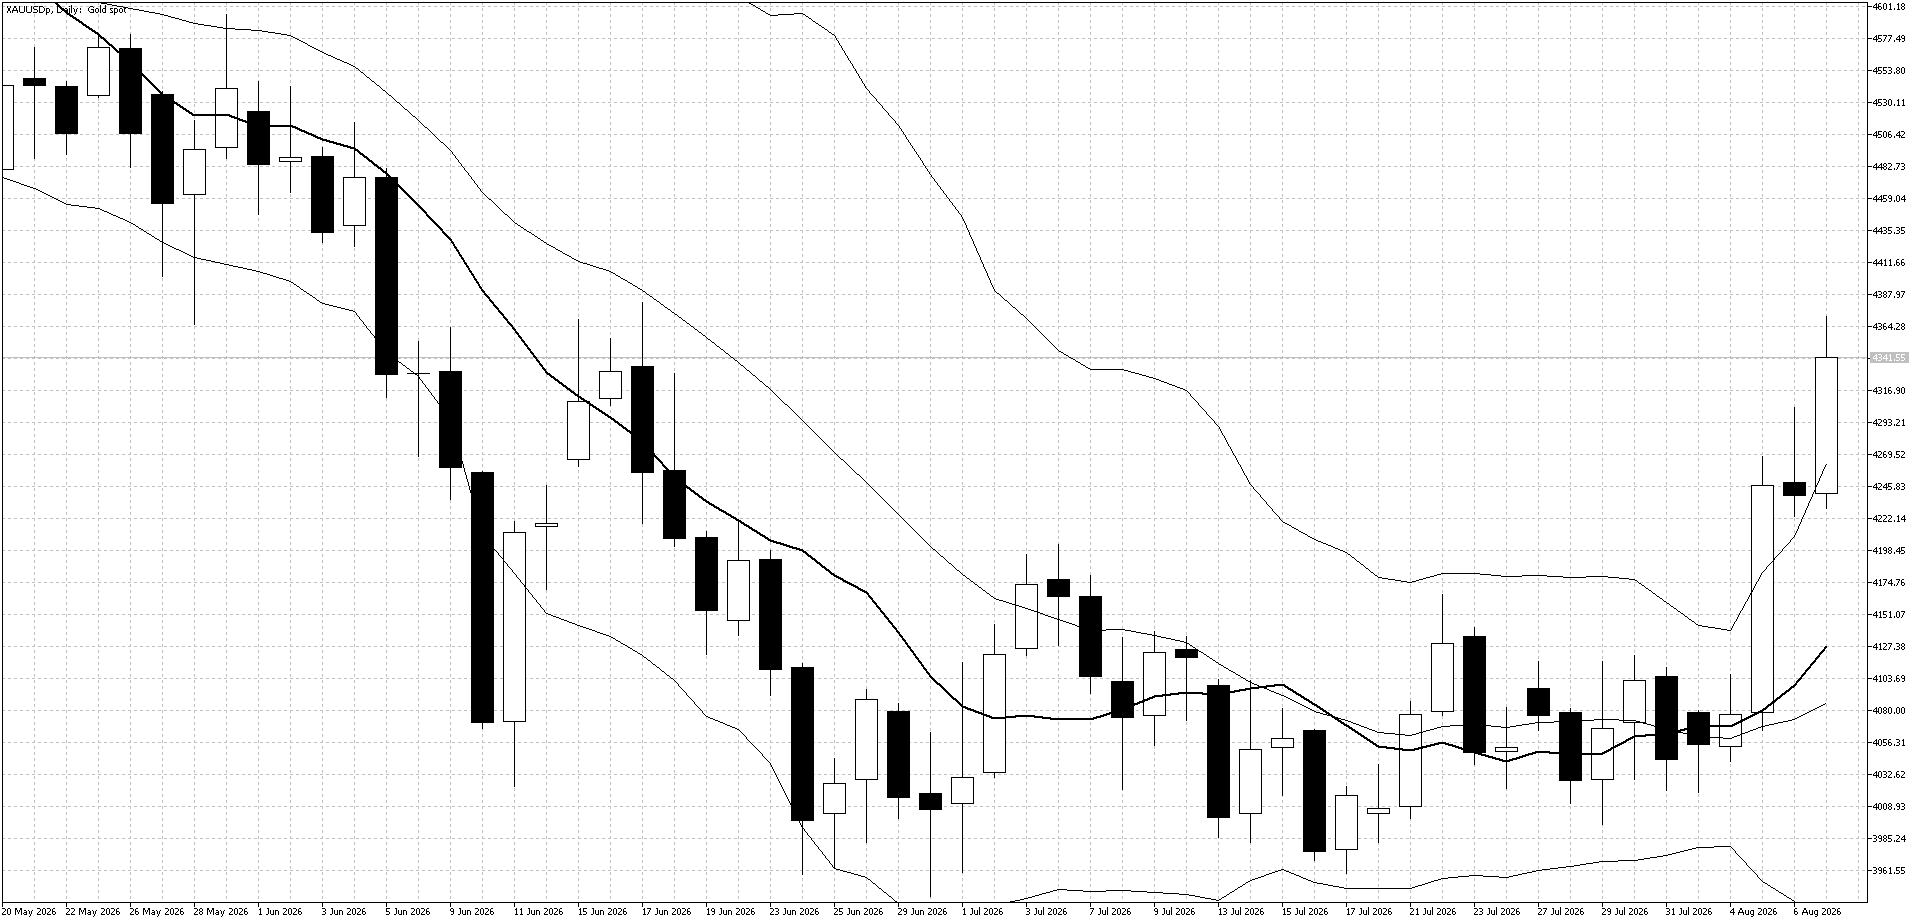
Gold surged higher last week as lower WTI crude oil prices and weak U.S. employment data pushed buyers back into the market. The strong rally broke the recent trading range and showed renewed buying interest.
Technical Picture
Gold moved well above the upper Bollinger Band, while the 10-day moving average has turned higher. This suggests a new uptrend may be starting, although the market is now overbought in the short term.
Outlook This Week
Strong support around $4,000 and easing inflation concerns as oil prices fall continue to support gold. The medium-term outlook is becoming more bullish, but after the recent rally, short-term traders may find both buying and selling opportunities. Medium-term traders may be better waiting for a pullback before looking to buy.
Take advantage of zero commissions on oil and indices – start today!
Markets will be watching U.S. CPI and PPI inflation data this week, as the results could move all major markets. Investors will also follow the ongoing U.S.–Iran talks and developments around the Strait of Hormuz. Later in the week, attention will turn to U.S. Retail Sales and the Michigan Consumer Sentiment Index, while traders will also watch for any further Japanese intervention to support the yen.

At Fintokei, I keep the operations and support engine running smoothly: processes, pressure, and people included. When I’m off the clock, I clear my head with a run in fresh air or hunt momentum on gold and US indices. Favorite platform: cTrader. Favorite challenge: ProTrader.