
Market Sector Scanner: Japan’s Investment Push Supports the Yen
The yen strengthened after Japan encouraged domestic investment, while gold recovered and the Nasdaq closed higher despite early pressure from rising oil prices. This week, U.S. CPI and PPI data will be the key events to watch.

Markets focused on the Federal Reserve minutes, which showed some officials supported higher rates, although the overall reaction was limited. In Japan, comments about more investment in domestic assets and gradual rate rises supported the yen and stocks, while higher producer prices kept inflation concerns in focus. Oil rose after fighting resumed but later fell as the U.S. and Iran agreed to continue talks.
Key Events Calendar
Market Outlook
Forex Market
USD/JPY
Last Week Recap
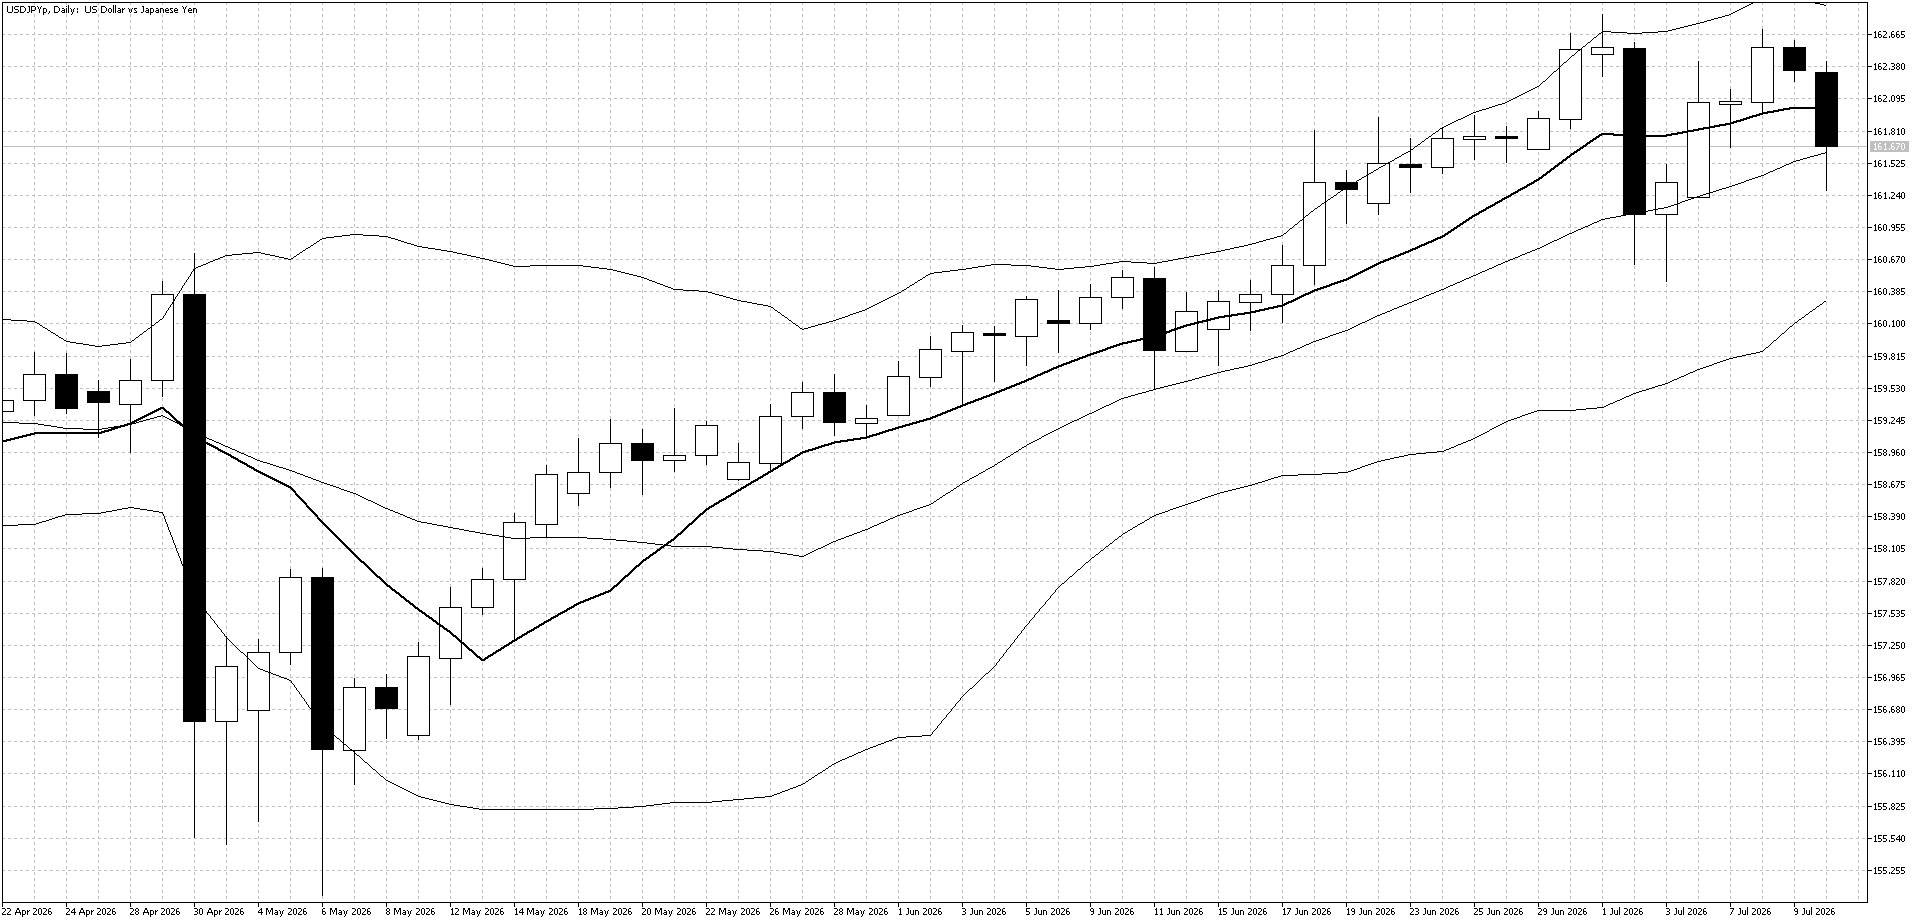
USD/JPY moved higher early in the week as renewed tensions between the U.S. and Iran pushed oil prices up and increased inflation concerns. Instead of directly intervening to support the yen, the Japanese government encouraged pension funds and other institutions to invest more in Japanese assets rather than overseas. This helped strengthen the yen later in the week.
Technical Picture
The weekly close below the 10-day moving average, with prices near the middle of the Bollinger Bands, suggests range-trading conditions in the short term.
Outlook This Week
USD/JPY may trade sideways this week, with strong resistance above and buying support below as U.S. interest rates are still expected to rise this year. U.S. inflation data could be important and may cause a larger move.
GBP/JPY
Last Week Recap
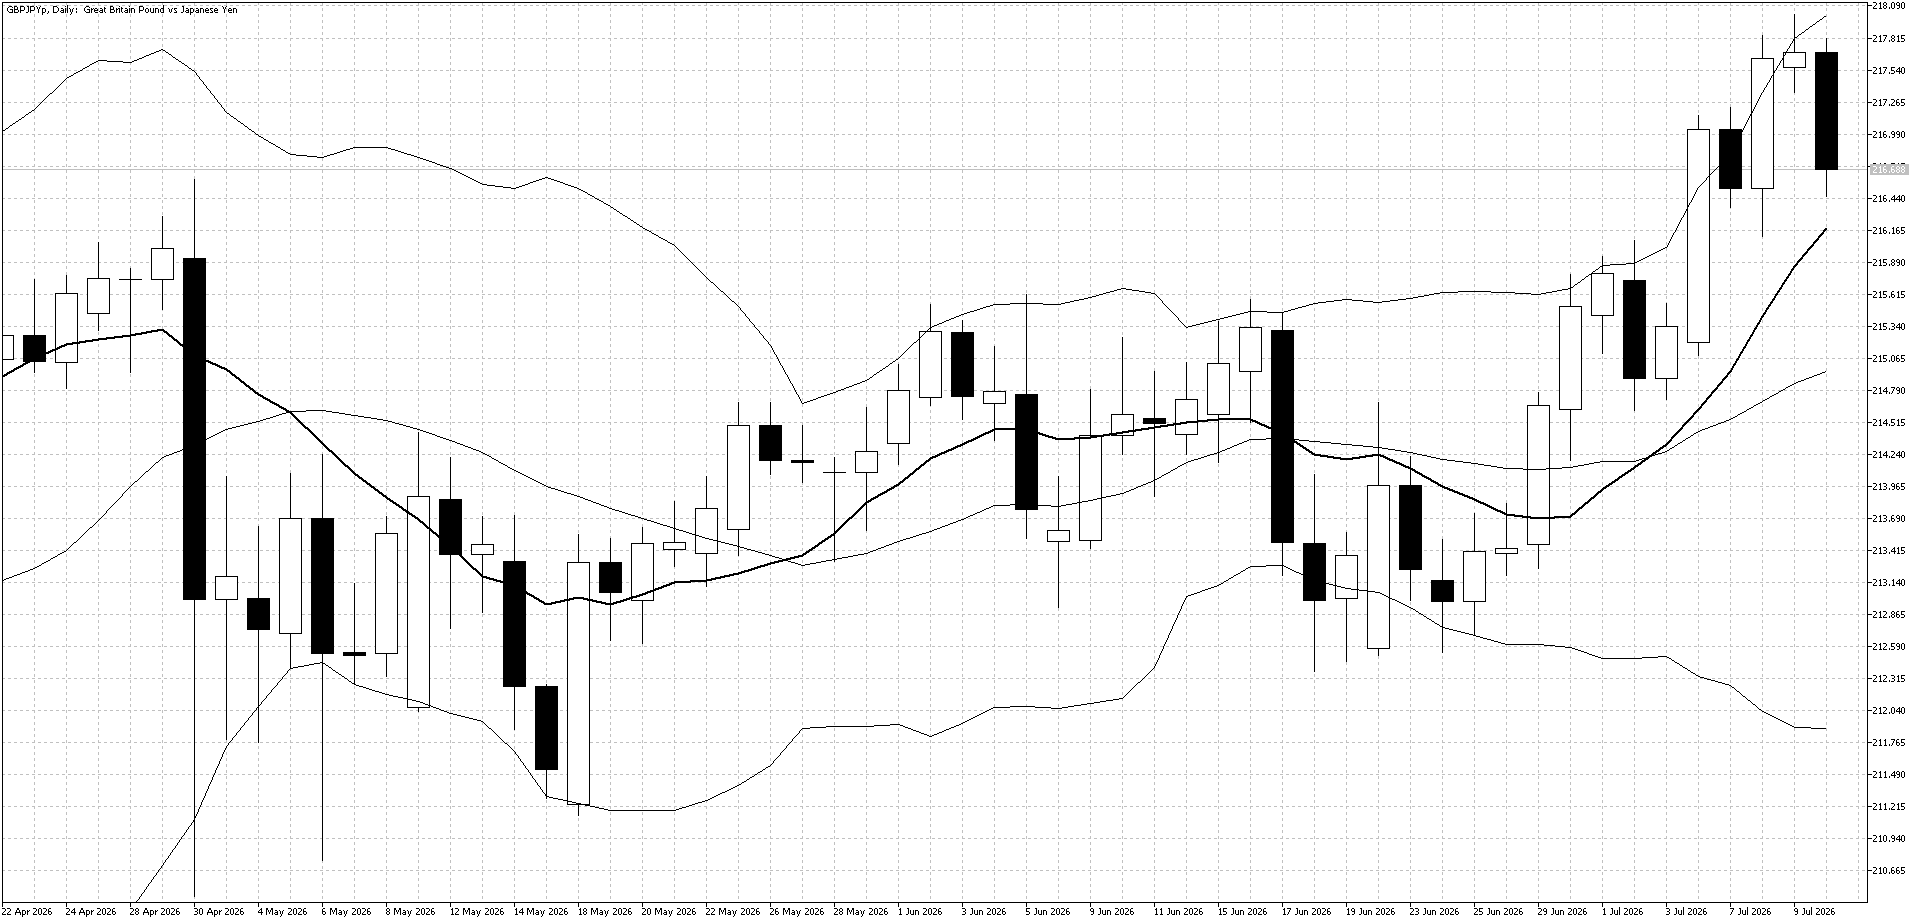
GBP/JPY had a strong week, reaching its highest level since 2008 as markets welcomed the likely smooth transfer of power to the new U.K. prime minister. The pair fell near the end of the week after the Japanese government encouraged more investment in domestic assets, which supported the yen.
Technical Picture
The upper Bollinger Band created a selling opportunity late in the week, while the pair pulled back toward the rising 10-day moving average.
Outlook This Week
The uptrend remains strong, so buying on weakness may be the better strategy this week.
EUR/USD
Last Week Recap
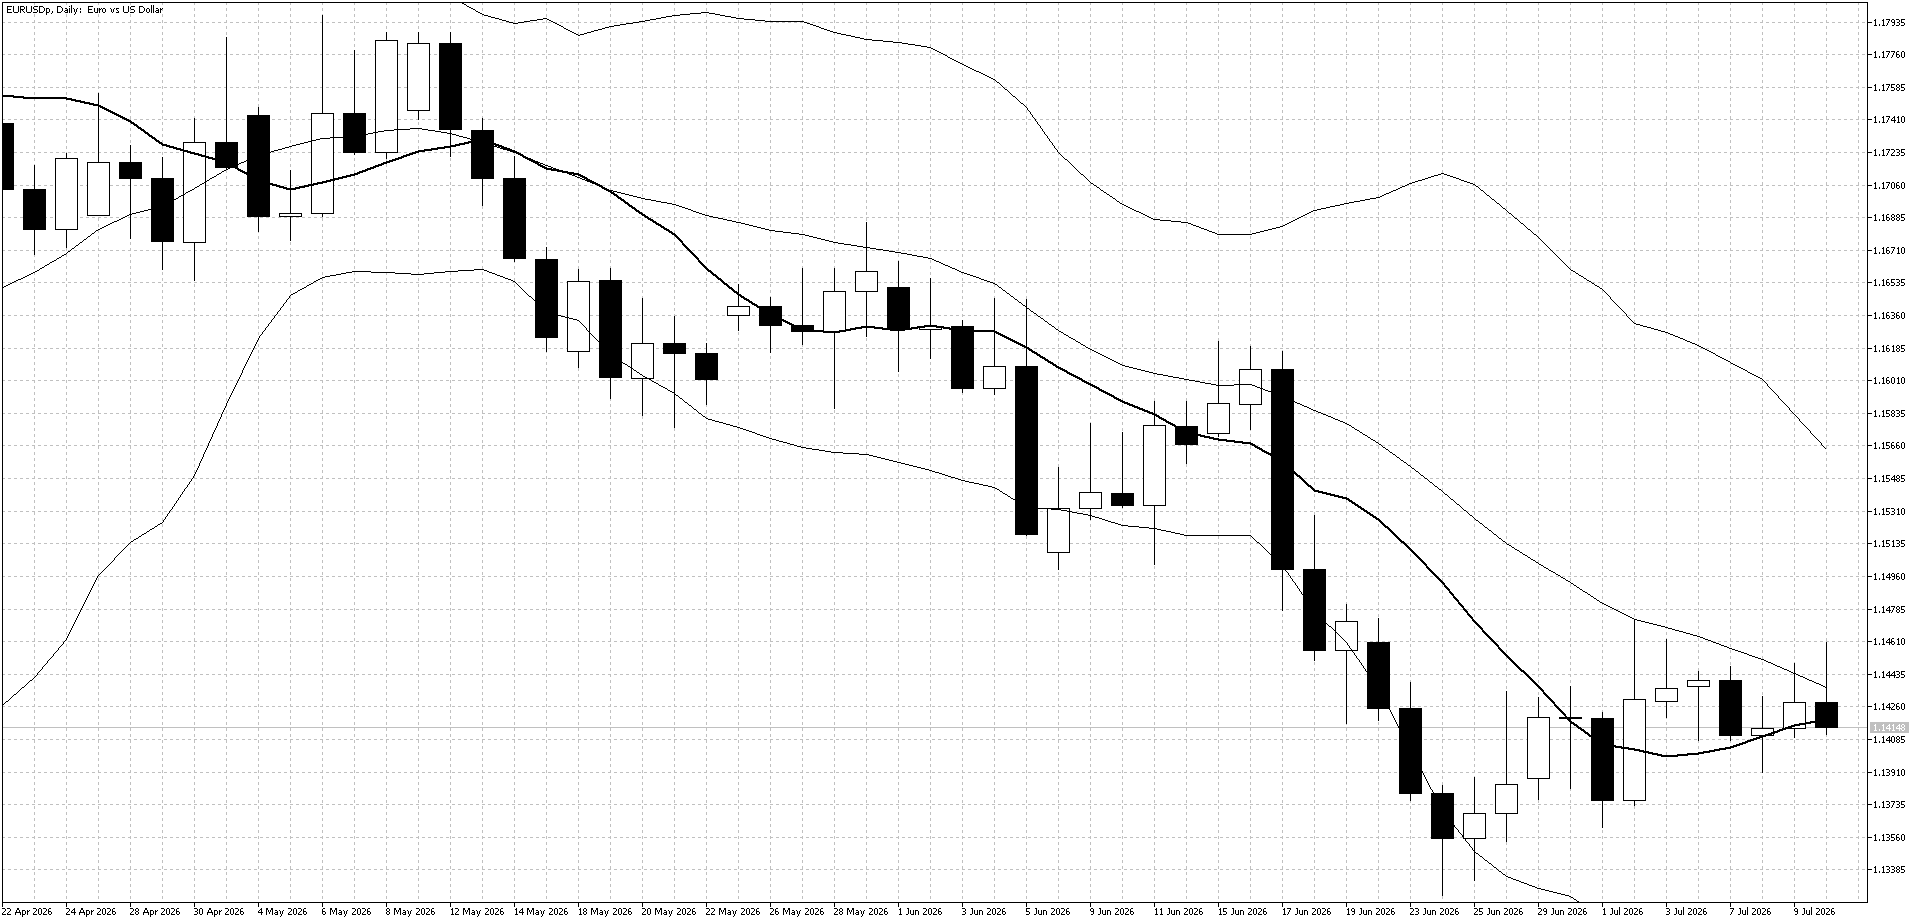
EUR/USD traded sideways after breaking its recent downtrend the previous week. There was little major U.S. economic data, while European data came in better than expected.
Technical Picture
The 10-day moving average has started to turn slightly higher, but the weekly close below this level suggests further gains may be difficult.
Outlook This Week
More sideways trading is expected, although the downtrend could return if U.S. inflation data comes in higher than expected.
Equities
U.S. Stock Market
Last Week Recap
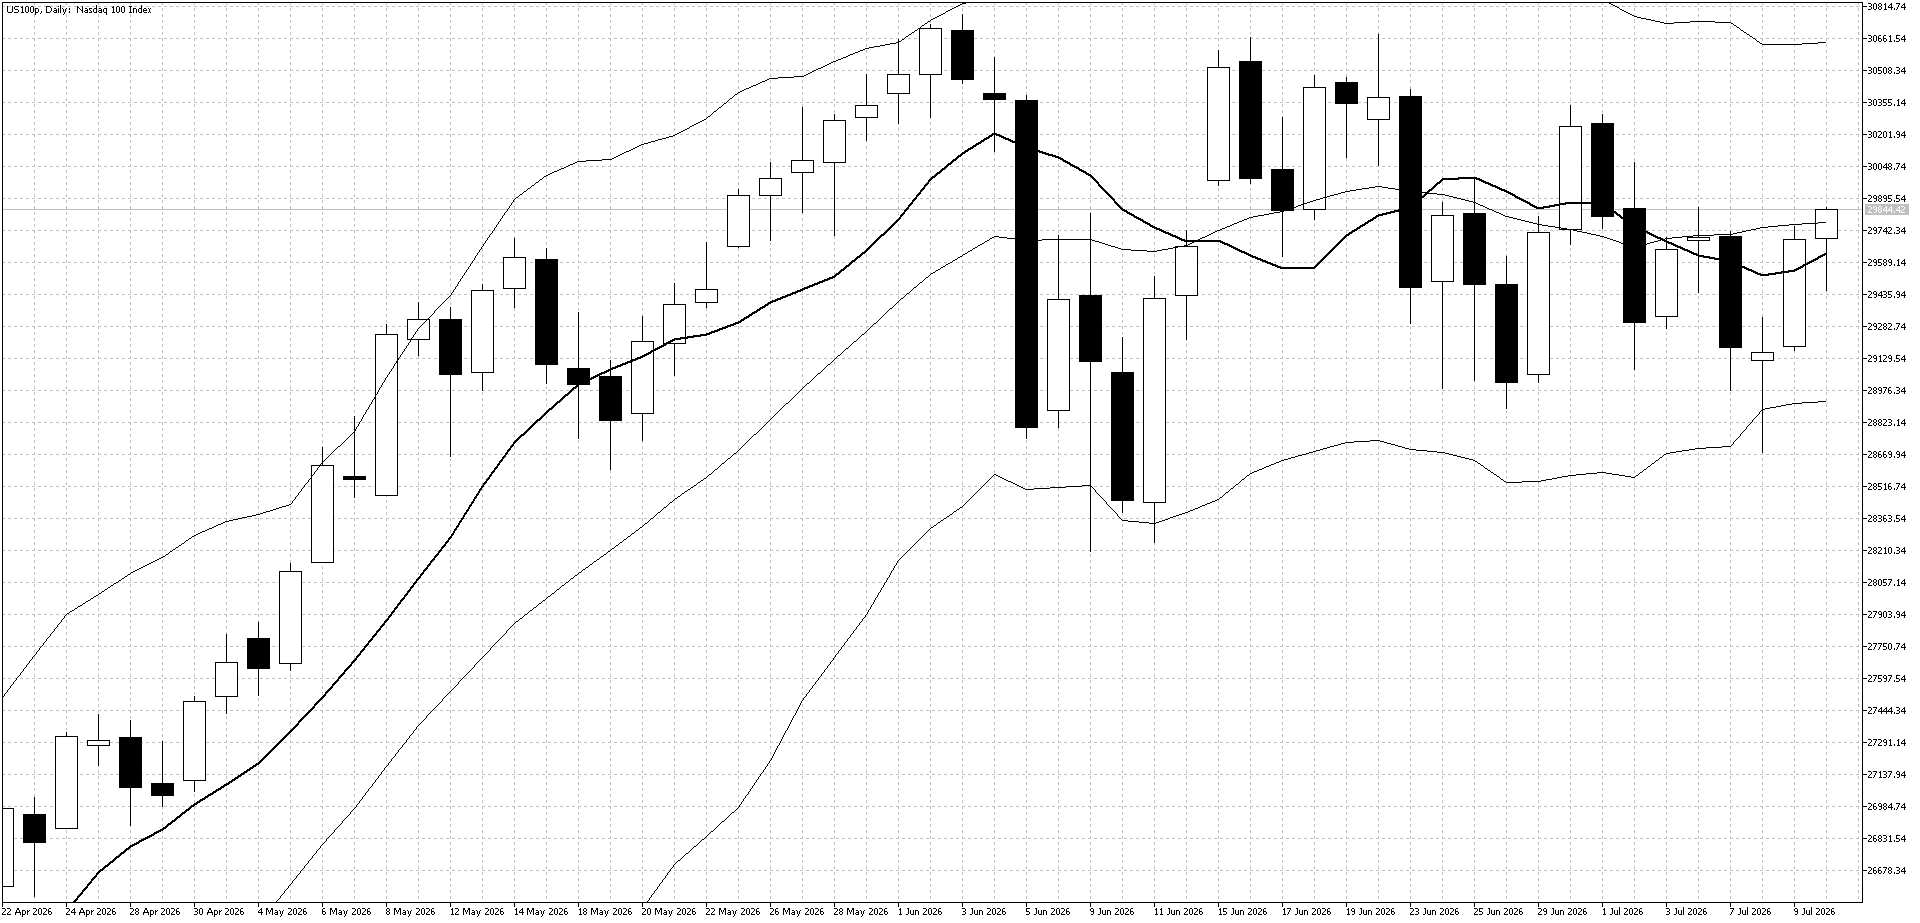
Higher WTI crude oil prices pushed the Nasdaq lower early in the week. However, continued interest in AI-related stocks helped the market recover and close the week higher in otherwise quiet conditions.
Technical Picture
The lower Bollinger Band acted as support and created a buying signal. The 10-day moving average is moving sideways, which suggests the market is trading in a range.
Outlook This Week
Conditions remain suitable for range trading, although patience may be needed while the market stays near the middle of the range. Medium-term traders may prefer to look for selling opportunities when prices move higher.
Commodities
Gold
Last Week Recap
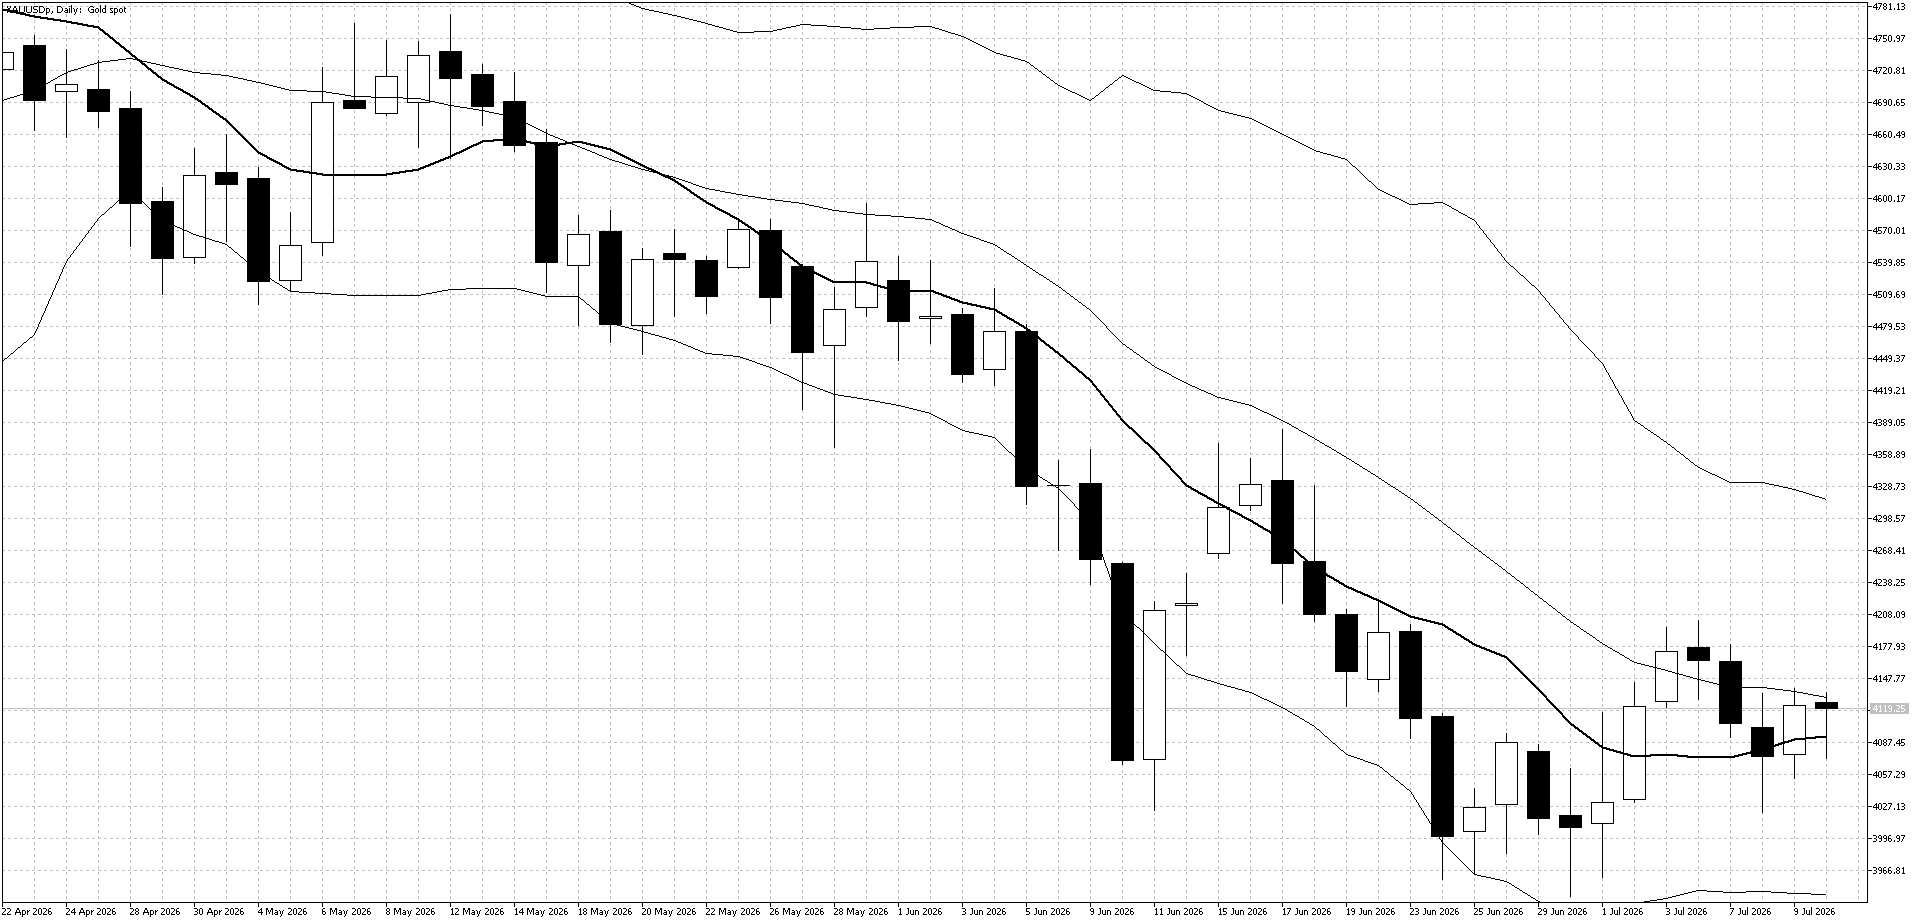
Higher crude oil prices early in the week caused gold to give back some of its recent gains. Concerns about high U.S. inflation and rising interest rates also remained a risk for gold buyers.
Technical Picture
Resistance held near $4,200, while prices finished around the middle of the Bollinger Bands. However, the close above the 10-day moving average was a positive signal.
Outlook This Week
The recent price action remains positive and the previous downtrend now appears to be over. Buying on weakness may offer the better strategy in the short and medium term.
Take advantage of zero commissions on oil and indices – start today!
Weekend talks between the U.S. and Iran will be closely watched, as any progress could affect oil prices and wider markets. Traders will also focus on U.S. CPI, PPI, retail sales and consumer confidence for clues about when interest rates may rise. Markets will also watch for further steps from the Japanese government to strengthen the yen.