
Support and Resistance in action: Trade like a pro (Finally!)
Support and resistance — aka the classic duo of technical analysis. These two can literally decide if you walk away with profit or loss. In this article, we’ll show you what they mean, how to spot them on your chart, and most importantly — how to use them like a boss.
What is support and resistance (really)?
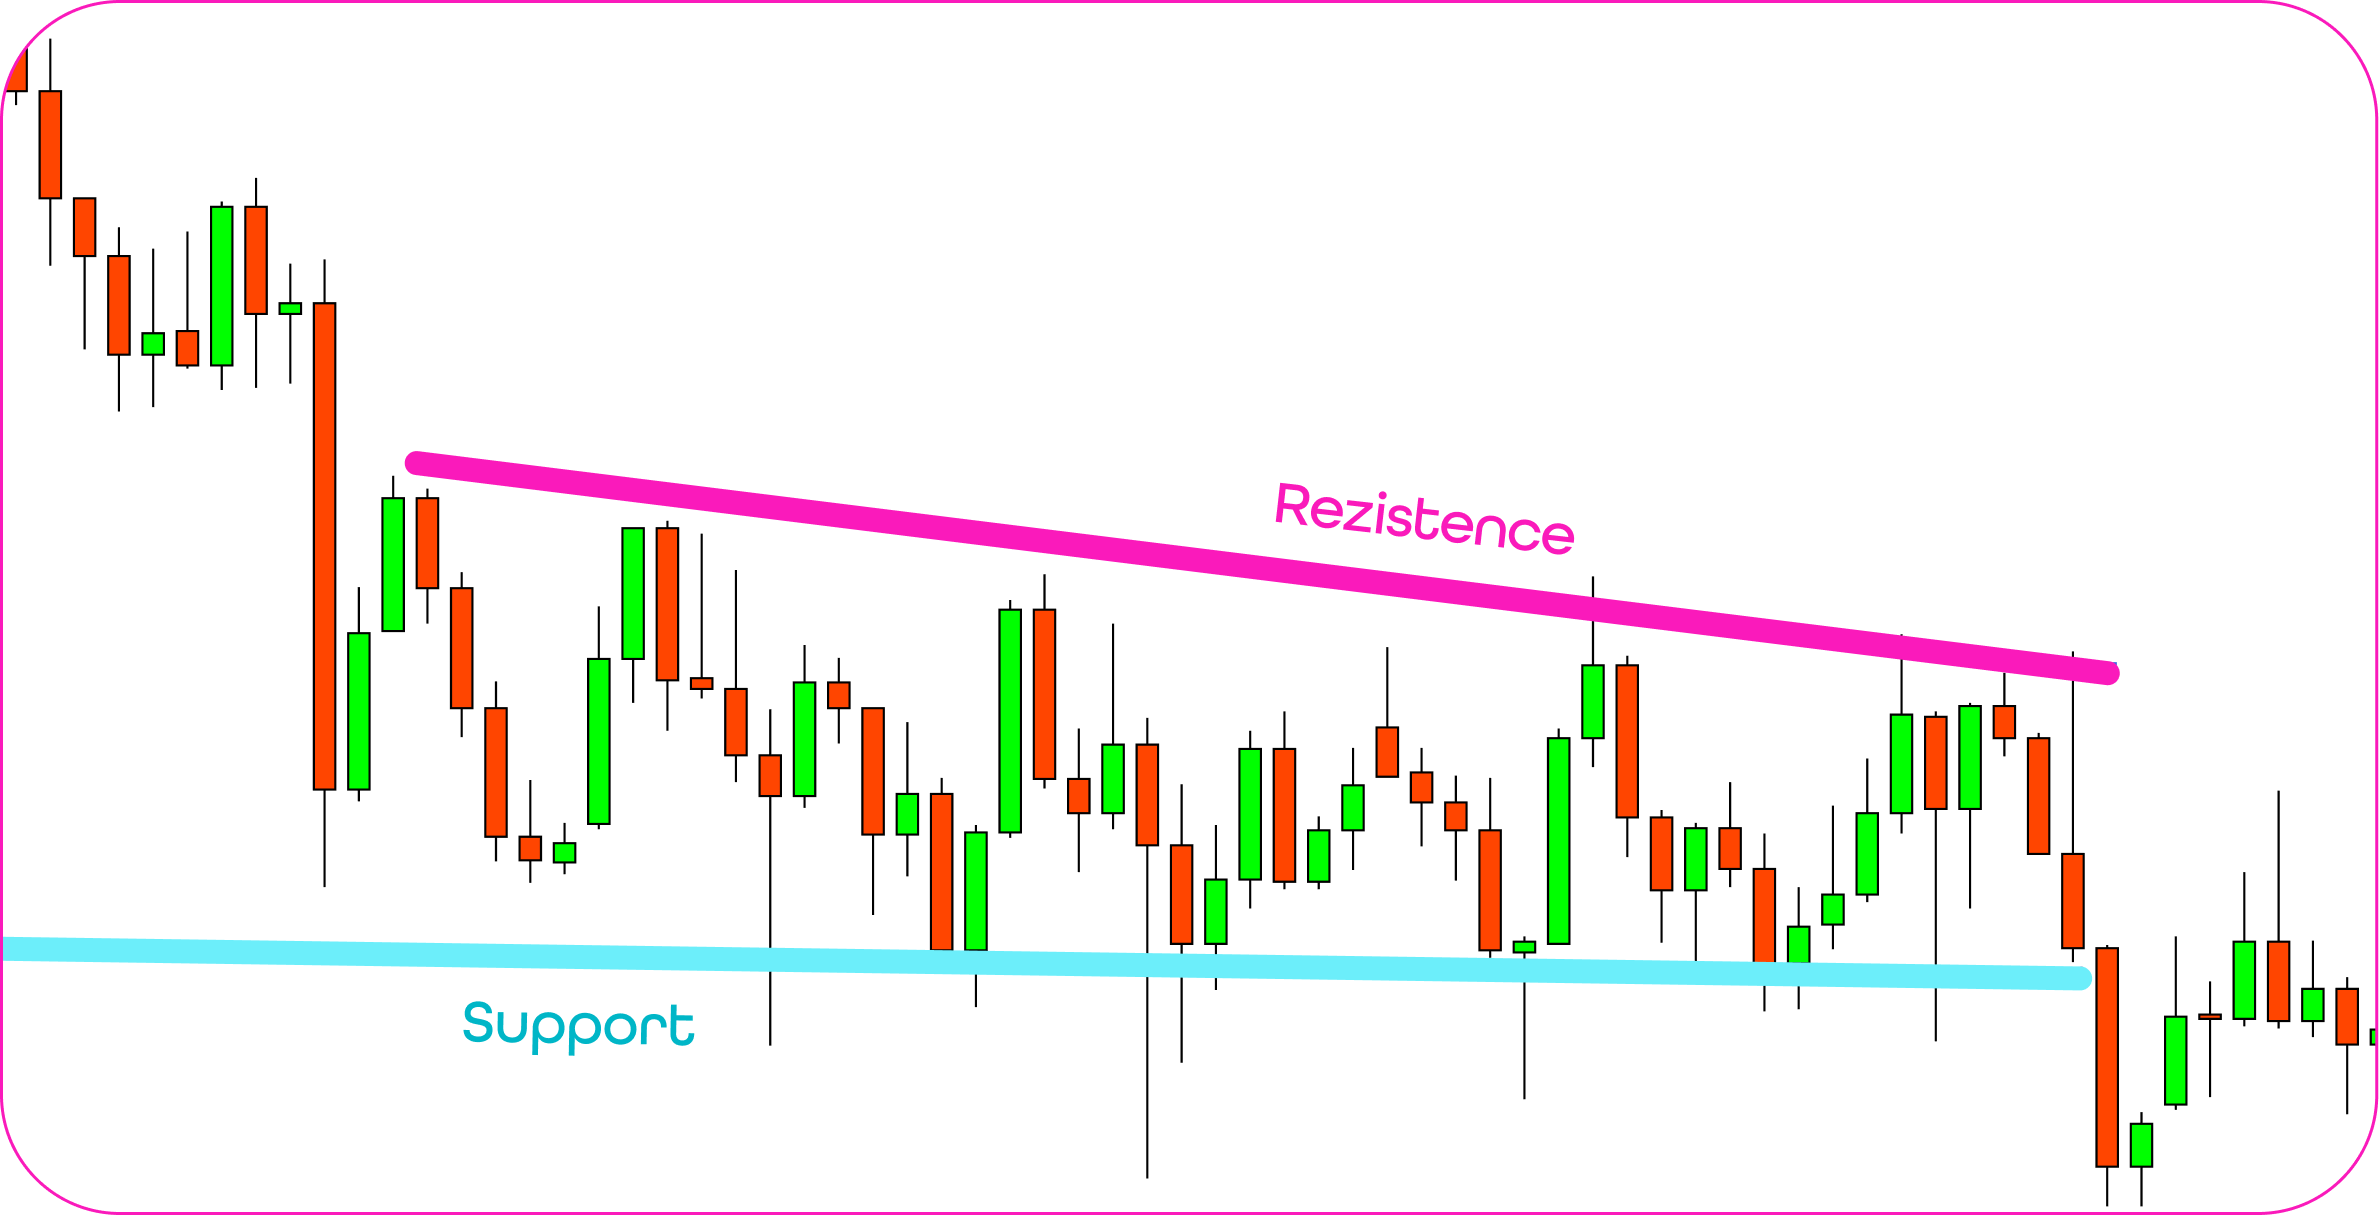
Support = a price level that “holds” the market from dropping further. You’ll usually see it where the price fell in the past but then bounced up again.
Resistance = a price ceiling where the price says “nah, not going higher” and starts to fall.
These are not just random lines. They’re psychological zones where buyers and sellers clashed in the past — and guess what? They still do.
On the chart, you’ll notice them because the price keeps turning around in those areas. The more it bounces, the stronger the level. Heads up: they’re zones, not laser-sharp lines!
Why support and resistance matter
If you don’t want your trading to feel like pure chaos, you need a trading plan. And guess what? Support and resistance can help you figure out:
- when to enter a trade,
- when to stay out,
- where to set your take profit and stop loss.
These levels are the foundation of technical analysis. But most beginners either skip them… or use them the wrong way. Not you though. You’ve got this.
FREE e-book
How to start with prop trading
Discover the secret to the discipline that turns everyday people into well-paid pro traders. Learn how prop trading works – and how you can start your own journey.
How to find support & resistance
Chill — it’s not rocket science. Just open a chart and look for spots where the price:
- stopped falling several times (support),
- got stuck on the way up (resistance),
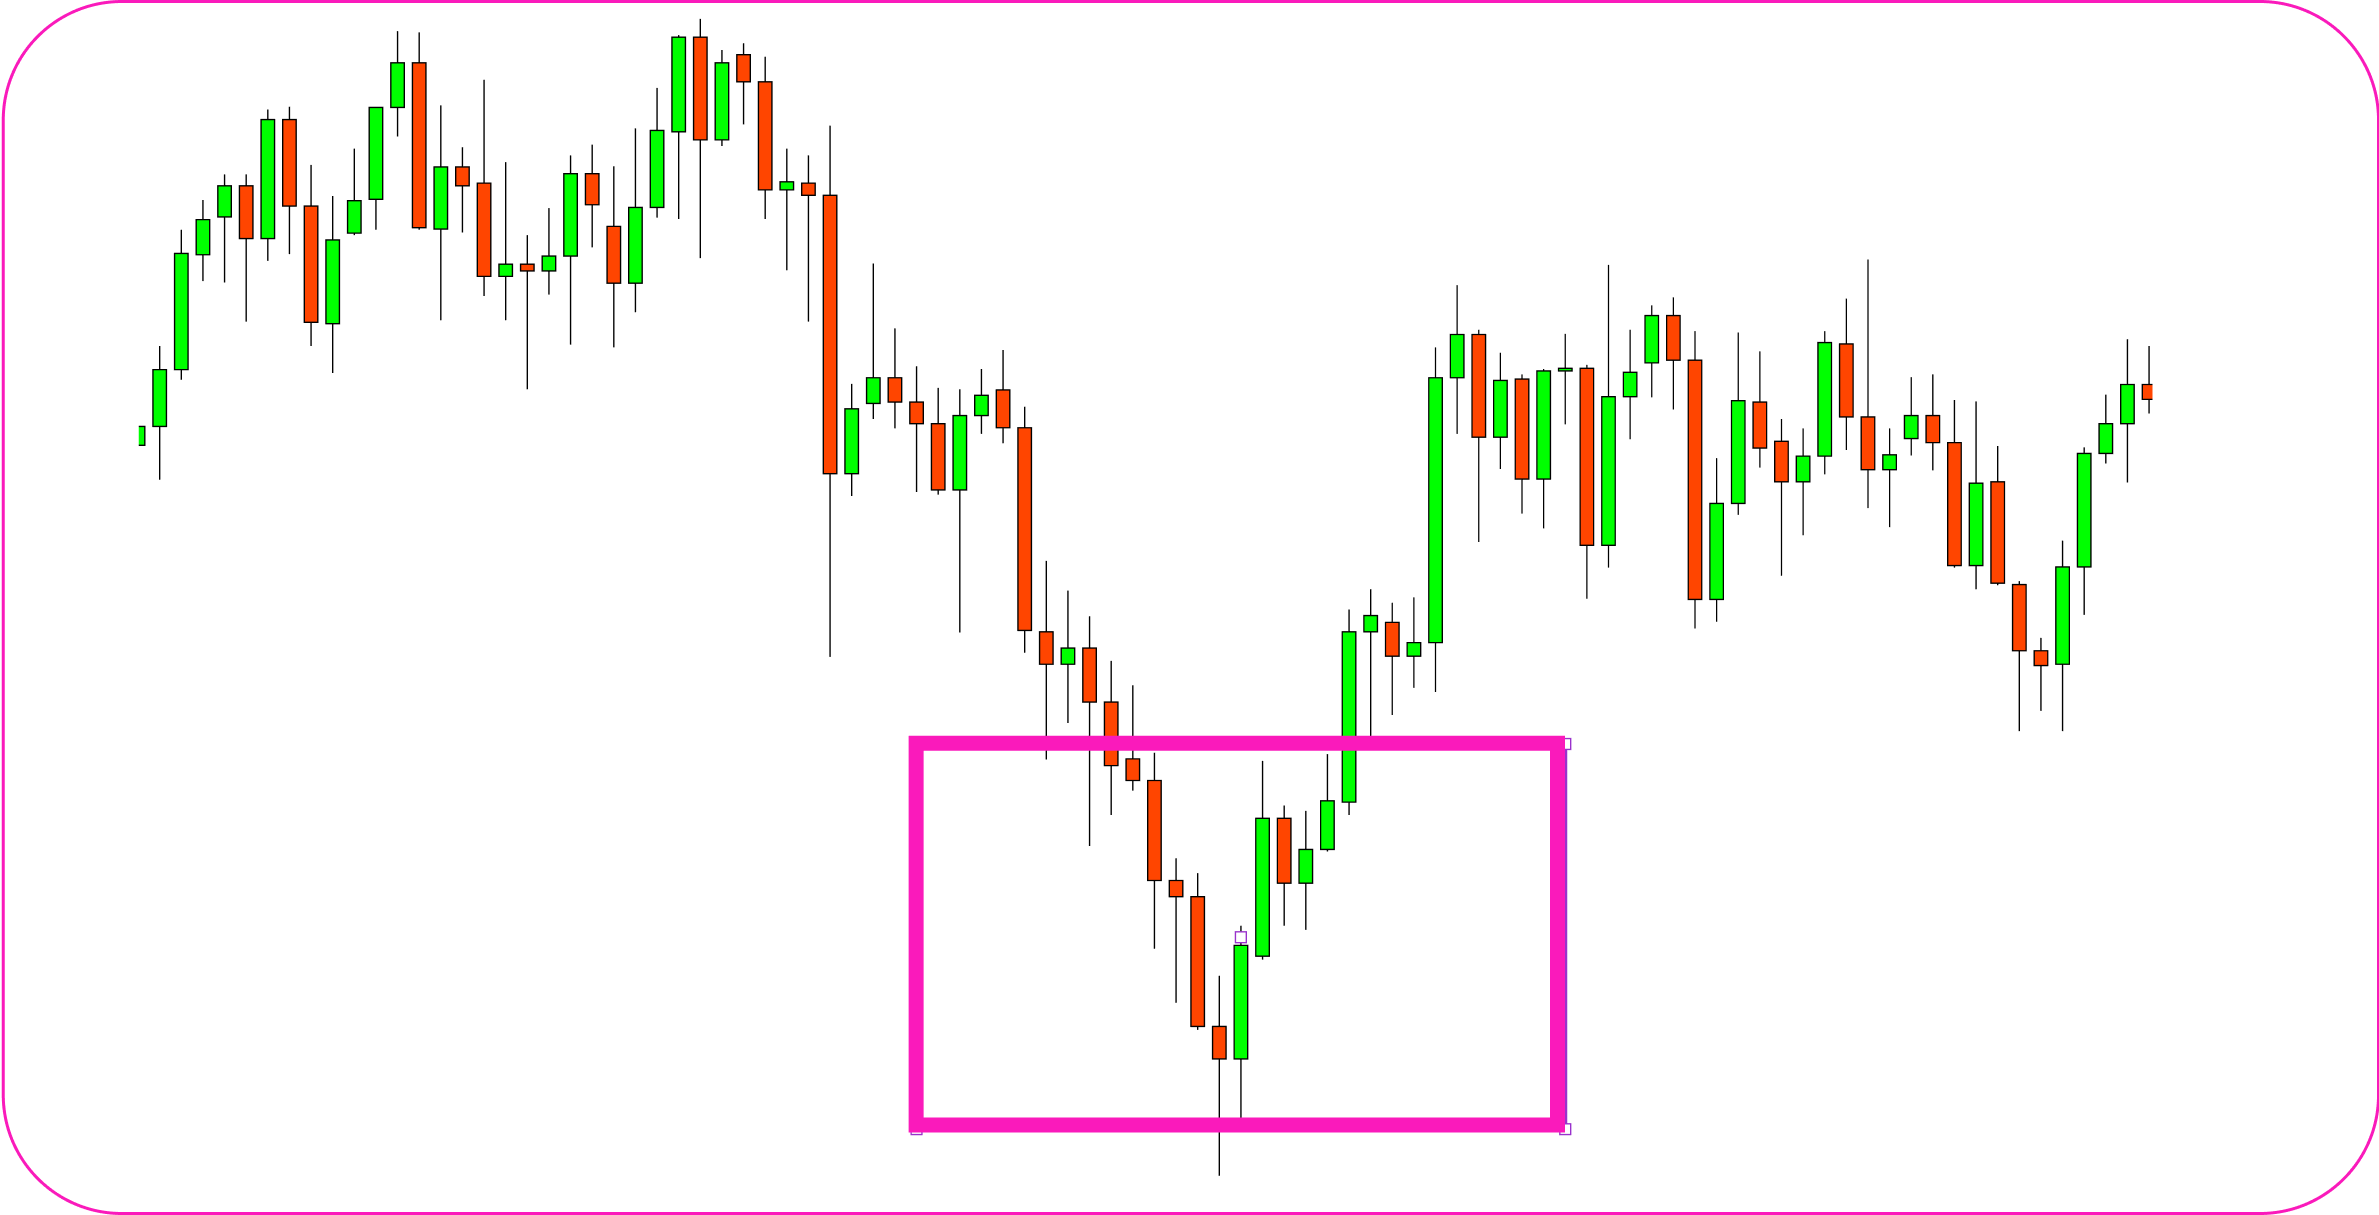
- made a big turnaround (like double top or double bottom patterns).
Let’s do it step by step
- Open a chart (1H or 4H is perfect).
- Find spots where price bounced multiple times.
- Draw a horizontal line — or better yet, highlight the whole area.
💡 Fintokei tip
You don’t need to be ultra-precise. These are zones, not exact price points.
Supply & Demand vs Support & Resistance
This part confuses a lot of traders, so let’s clear it up.
Supply & Demand = fresh zones with unfilled orders from big players. When the price hits them the first time, expect a strong reaction.
Support & Resistance = zones that got tested over and over. You already know how price reacts here. Great for managing open trades or moving your stop loss.
So when should you use what
- Want to enter a trade? Watch for fresh S&D zones.
- Already in a trade? Use S&R levels to manage it like a pro.
How to trade support and resistance – step by step
Support and resistance show you where to jump in with smart risk. Here’s how to do it, even if you’re totally new:
Step 1 – spot the zone
Start with a higher timeframe — H1 or H4 is your best bet. Look for places where the price made a sharp U-turn — like it suddenly shot up or dropped hard.
Look for:
- last major highs or lows,
- spots where price turned around multiple times,
- strong impulsive candles followed by a reversal.
💡 Fintokei tip
Not sure if it’s a strong zone? Check how fast the price reacted. The faster the bounce, the more likely it’s a real S&D zone.
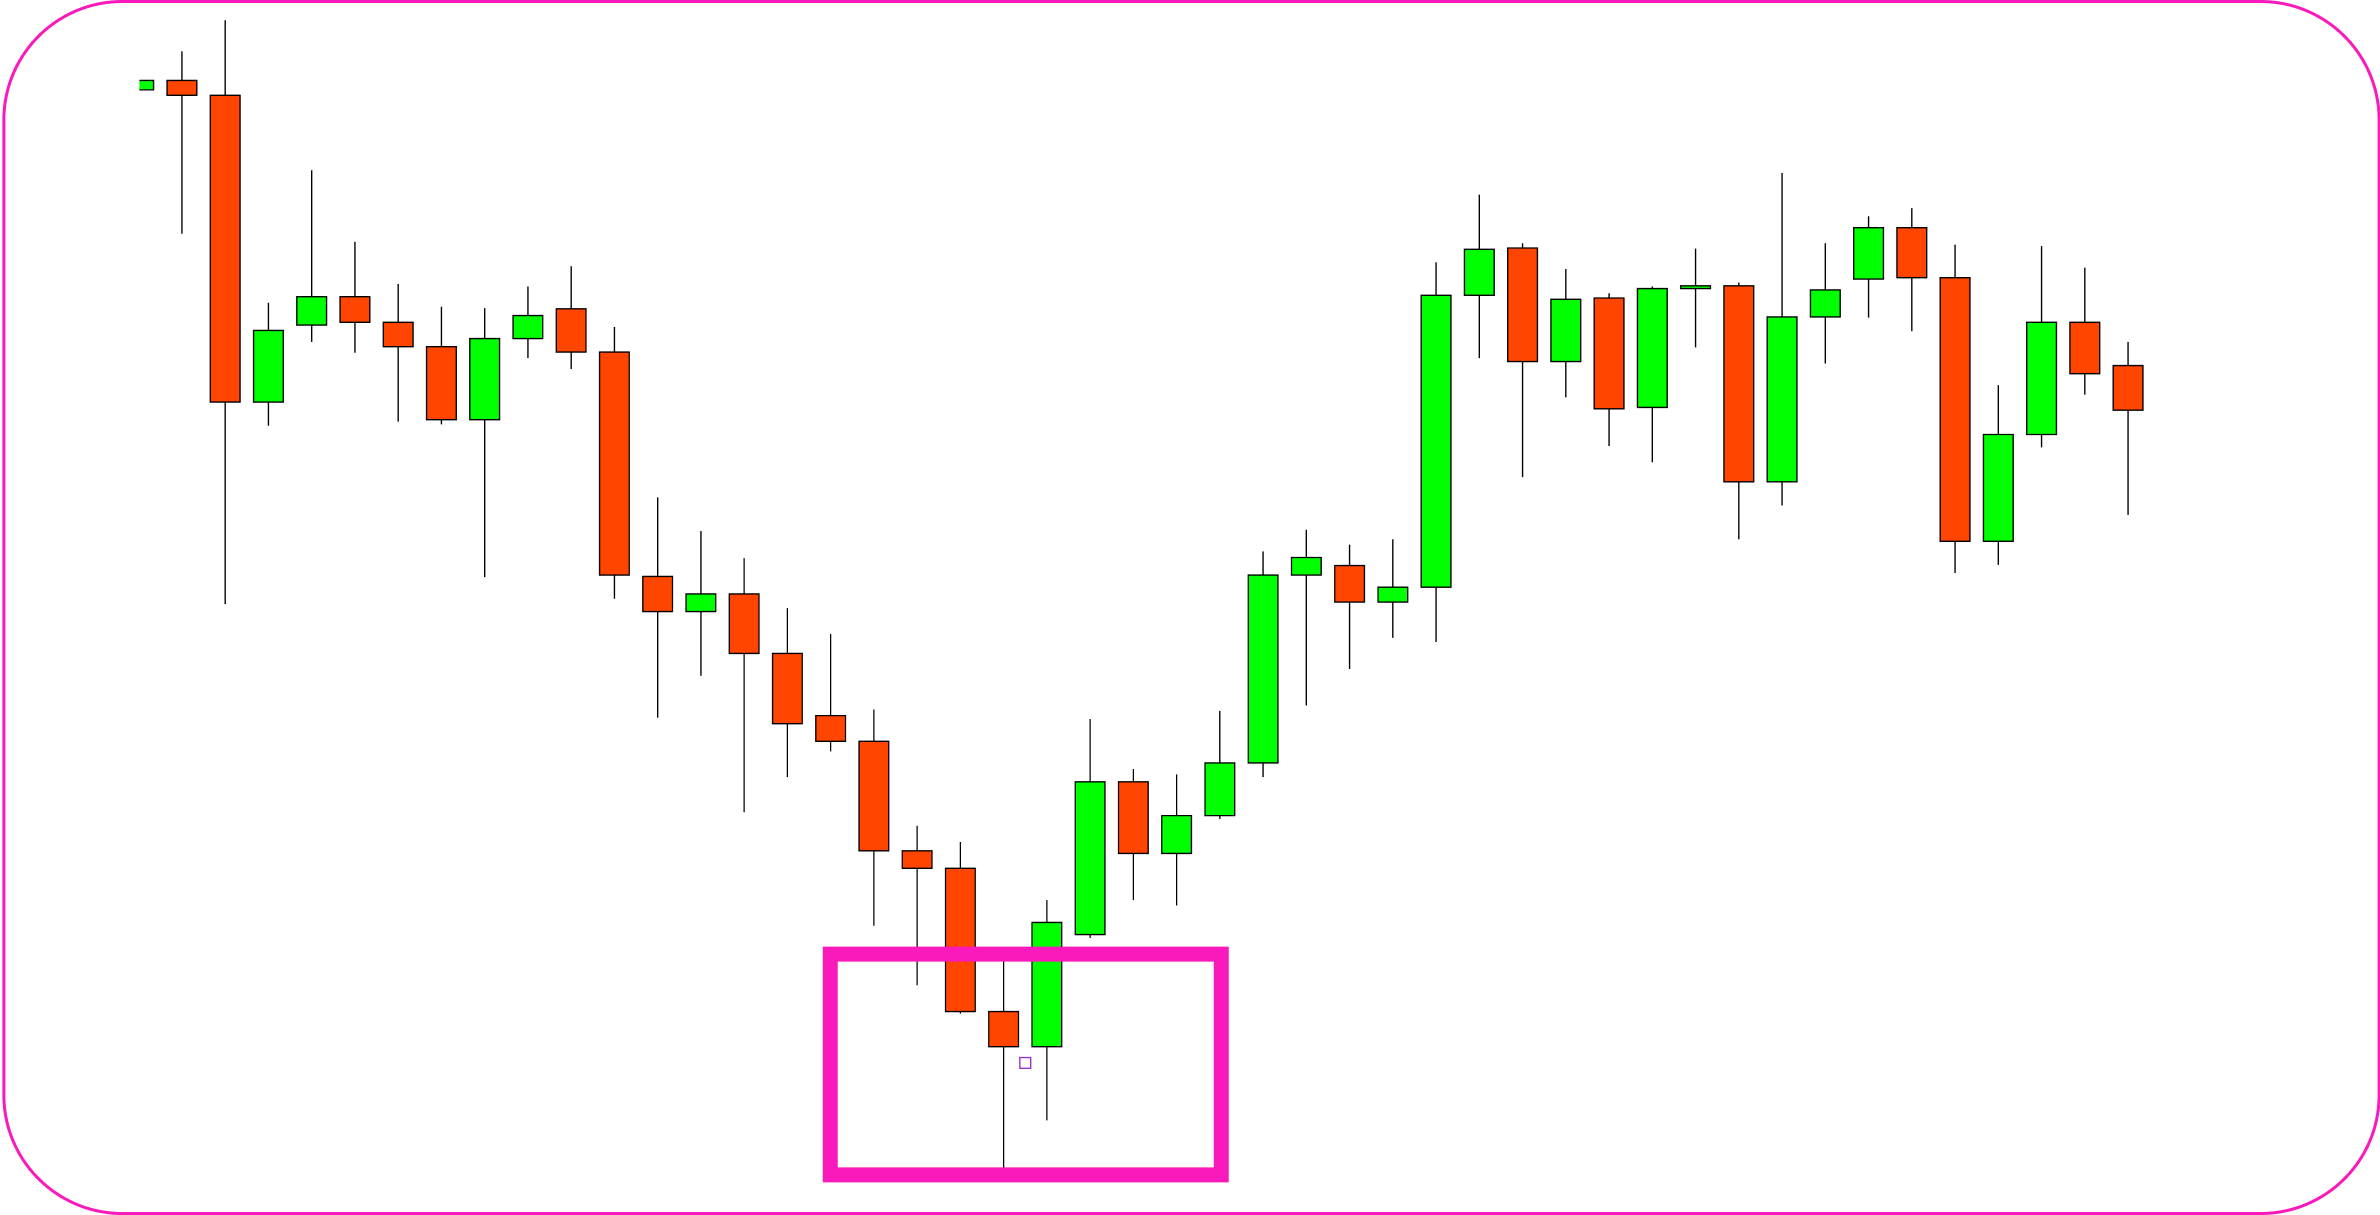
Step 2 – draw the zone
Don’t just draw one thin line. Highlight a price range where the turnaround happened. Usually it’s a few pips wide.
Use tools like:
- rectangle tool in MT4 or TradingView,
- set the top and bottom of the zone using the candle body and wick that kicked off the move.
💡 Fintokei tip
Remember: support and resistance aren’t exact points. They’re reaction zones.
Step 3 – wait for price to return
This is where patience kicks in. Don’t rush into a trade just because you found a zone. Wait for the price to come back to it.
💡 Fintokei tip
It might take a few hours — or even days. Watch volume and speed. Slow return = weak reaction.
Step 4 – watch the reaction
When the price touches the zone again, observe! Look for signs the level is being respected:
- candlestick patterns like pin bar, doji, engulfing,
- a small pause followed by movement back,
- divergence on indicators like RSI.
💡 Fintokei tip
If you don’t see any of these — don’t trade. It’s better to miss a setup than lose on a bad entry.
Step 5 – set your SL and TP
Got your signal? Nice! But it means nothing without good risk management:
Stop Loss (SL): Place it beyond the zone — not right at the edge. Give it room, but not too much. Aim for below/above the last swing high or low.
Take Profit (TP): Aim for the next opposite zone — support if you’re short, resistance if you’re long. You can even take partial profit and move SL to breakeven.
Risk-Reward Ratio: Always go for at least 1:2. If the trade doesn’t offer that — skip it.
Support and resistance in real life
Let’s say EUR/USD dropped a few times and found support around 1.0800. Each time it bounced from there. Boom — we’ve got a support zone.
Then it climbs up to 1.1000, but the price gets stuck — again and again. That’s your resistance.
What to watch next
If price drops back to 1.0800, pay close attention:
- Do you see confirmation? Like a pin bar or strong bounce? → Go long, target around 1.1000.
- No bounce and price breaks through? Wait — if 1.0800 turns into new resistance, it could be a short setup. But again — only with confirmation.
Beginner mistakes to avoid
🚫 Drawing exact lines instead of zones – The market doesn’t care about your line at 1.12345. It reacts in areas — not on the pixel.
🚫 Trading on super low timeframes – M1 or M5 is a war zone. Start with H1 or H4 where the real structure forms.
🚫 Ignoring fundamentals – Interest rates just got hiked? Your support might get crushed. Keep an eye on the calendar.
🚫 Jumping in without confirmation – Wait for real signs — patterns, volume, reaction. Don’t guess. Guessing costs.
Let’s do this!
Now you know what support and resistance are, how they differ from supply and demand, and how to trade them smartly. No fluff — just tools you can use today.
✅ Open a free trial demo trading account
✅ Load up some charts
✅ Start hunting for your first zones
Take screenshots, write notes, and learn from your trades. This is where the fun begins. TIP: Learn the basic trading terms too — without them, you’re not going anywhere.


