
Oil trading swing strategy
2026 could be the year of oil. That’s why we’ve prepared a simple swing trading strategy that helps you squeeze the most out of oil. Without spending endless hours staring at your screen.

In our previous article, we shared 5 reasons to trade oil in 2026. Today, we’ll show you a strategy you can actually use. It’s based on swing trading, which means higher timeframes and less time in front of the charts. The benefits of this strategy are clear:
- You only need to know one candlestick pattern
- It takes just a few minutes a day
- No fancy tools required. A clean chart is enough
- Perfect for beginners and advanced traders alike
Which trading platform should you choose?
It doesn’t really matter. At Fintokei, you can trade on TradingView, MT5, or cTrader. The key is to set your platform to display candlestick charts. Candlesticks are the foundation of effective technical analysis and price action, and that’s exactly what this strategy is built on.
All platforms we offer support candlestick charts, so let’s get started. First, we’ll look at how to analyze the market and find the ideal entry point.
Step 1: Finding the Entry
This swing strategy makes full use of 3-4 timeframes:
- W1 (weekly)
- D1 (daily)
- H4 and H1 (4-hour and 1-hour)
As a general rule, we always work from higher timeframes to lower ones.
The weekly chart (W1) shows you the overall market context. The so-called bigger picture. Each candle represents one week, allowing you to quickly understand the dominant trend over the past several months. And that’s exactly what you need.

The daily chart (D1) helps identify key support and resistance levels. Price tends to react strongly around these zones, and those reactions are precisely what we aim to trade with this strategy.

The H1 and H4 timeframes allow you to fine-tune your entry. The more precise your entry, the greater your potential profit if the trade works out. These timeframes are also where you place your stop loss and take profit. Never forget those!

Step 1 summary:
- Identify the main trend in oil (never trade against it if you’re a beginner)
- Mark support and resistance zones on the daily chart
- Wait for price to approach these zones on H1/H4 and look for a potential bounce
Enjoy the full ProTrader Swing experience
Step 2: Confirming the Setup with a Pin Bar
Now it’s time to fully use the only candlestick pattern you need for this strategy: the pin bar.
We wait for the price to react at a previously marked support or resistance zone. But before entering the trade and risking capital, we need confirmation: something that increases the probability of a reversal rather than a breakout.
The pin bar is a reversal pattern, meaning it usually appears shortly before the price changes direction. That’s exactly why it’s perfect for this strategy.
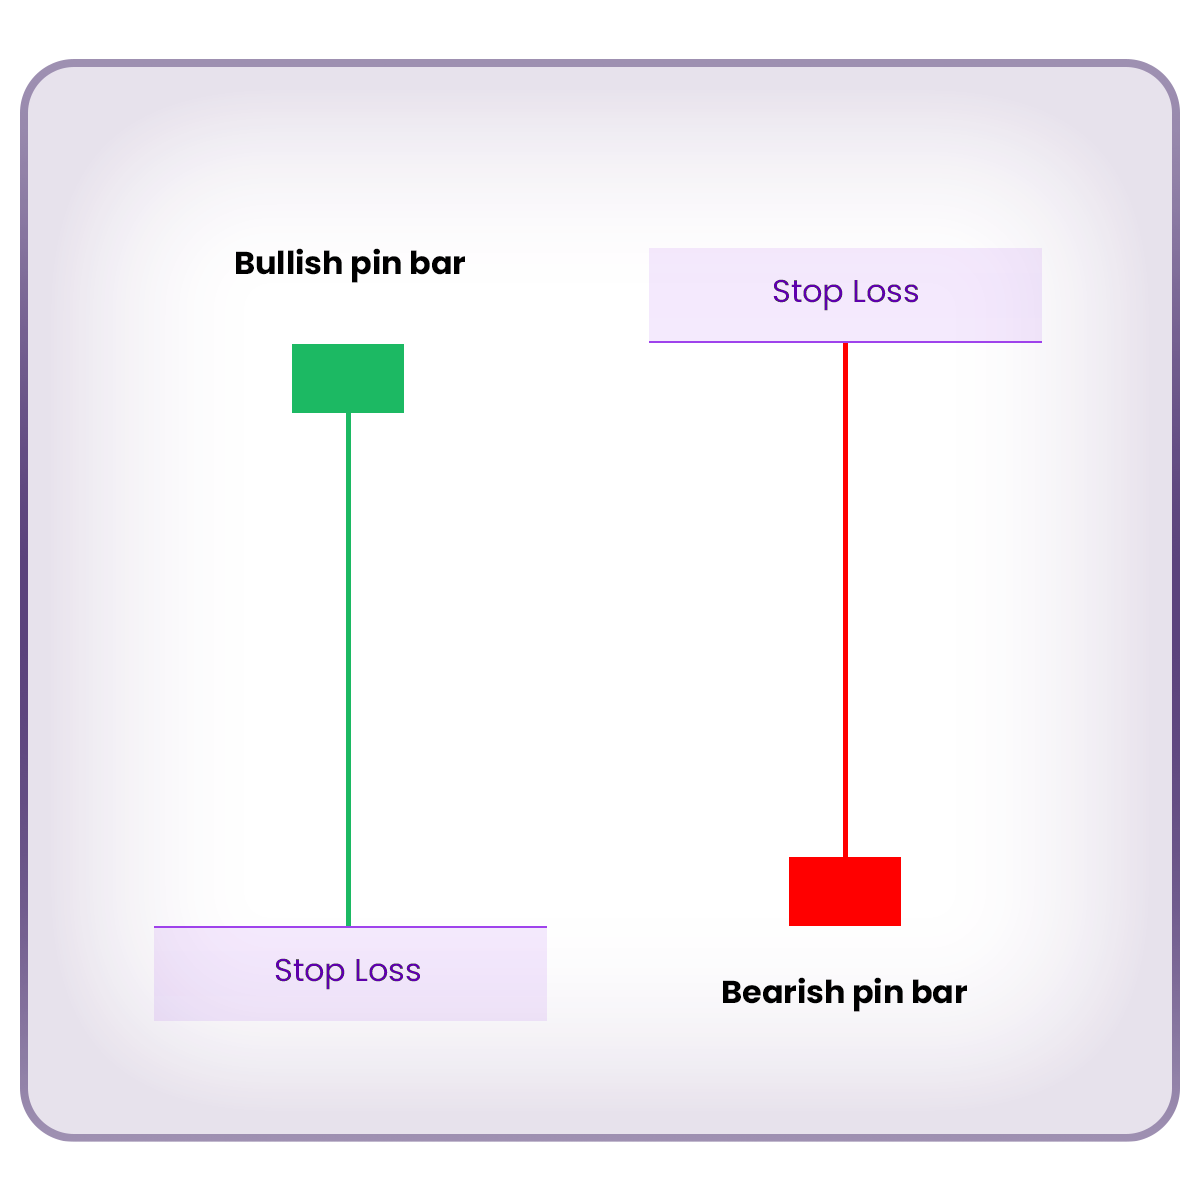
- A pin bar signals a trend reversal
- Bearish pin bar → potential move down
- Bullish pin bar → potential move up
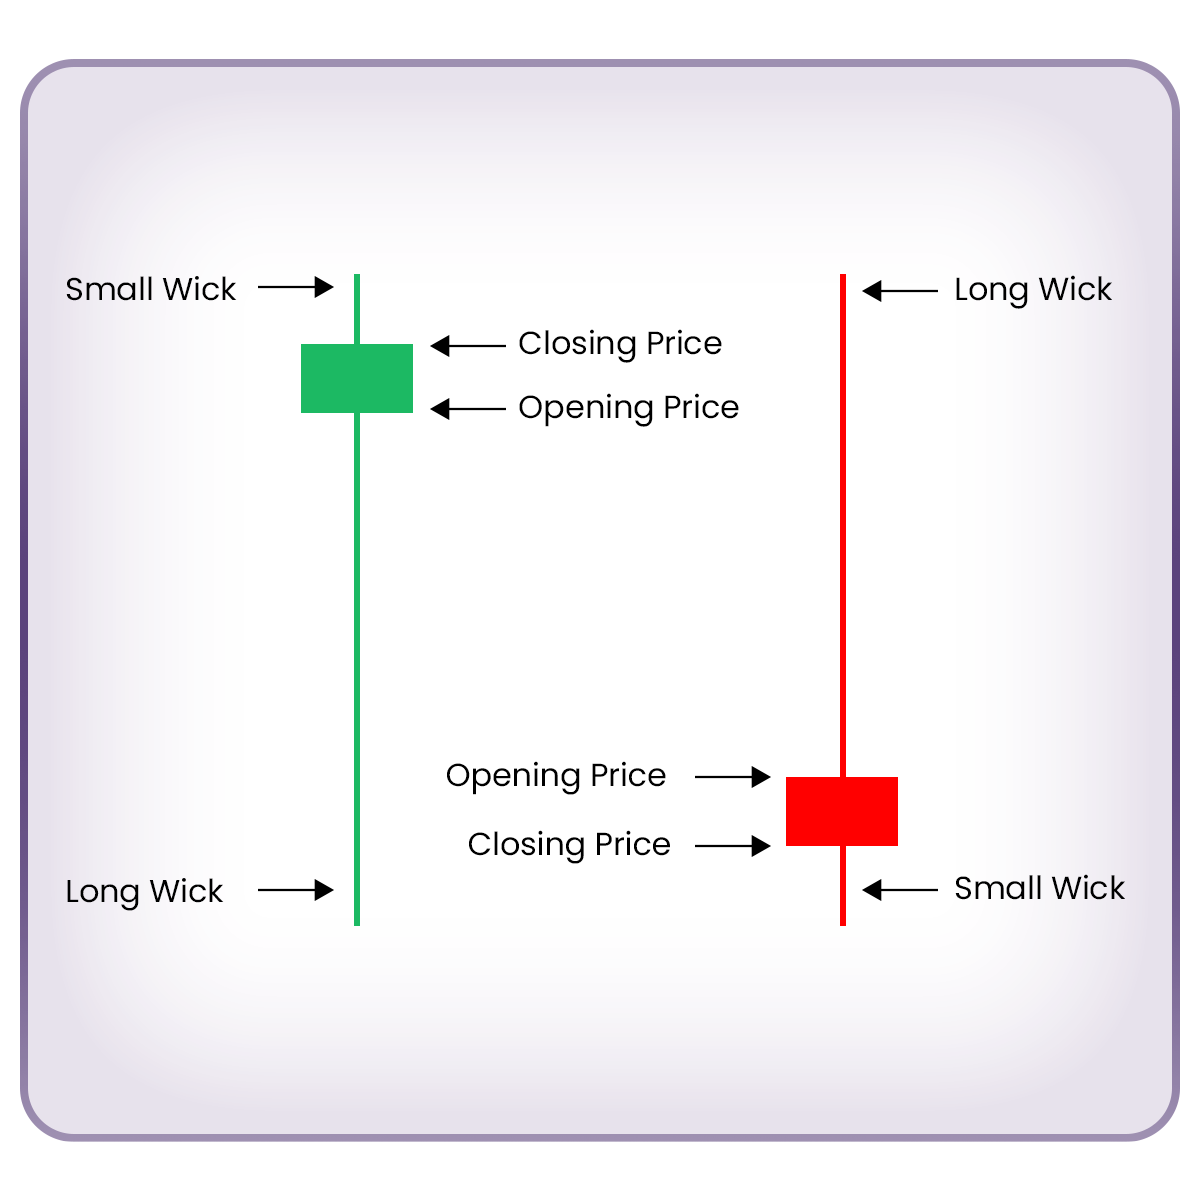
How to recognize a pin bar:
- The open and close occur inside the body of the previous candle
- The wick (shadow) sticks out significantly (the longer the wick and the smaller the body, the stronger the signal)
Ideally, the candle closes near the high or low of the previous candle
At this point, you know exactly what to look for as confirmation. The full process looks like this:
- Identify the main trend in oil (W1)
- Mark S/R zones (D1) and wait for the price to reach them
- Switch to H1/H4 and wait for a pin bar to appear

Step 3: Entry, Stop Loss, and Take Profit
Price has reacted to the daily S/R zone, and a pin bar has formed: it’s time to trade!
Before you start counting profits, remember to control your risk like a pro. At Fintokei, you usually have unlimited time to pass your challenge. Profits can wait. But once you exceed the daily or maximum loss limit, it’s game over.
Stop Loss
- Place the stop loss above the long wick of the pin bar when going short
- Place it below the wick when going long
Take Profit
- For short trades → target the nearest support
- For long trades → target the nearest resistance
Position size depends on your Risk Reward Ratio (RRR). Our data shows that Fintokei Stars, traders who reach at least 3 payouts, typically use an RRR of 1:2, meaning the potential reward is twice the risk. Also, risking more than 0.5% of your account per trade may not be worth it.

Before You Trade This Strategy
Markets often behave chaotically and irrationally. Even when all signals align, the expected bounce may never happen. That’s exactly why you use a stop loss.
Your job is to accept that losses are a normal cost of trading.
Before applying this strategy in a live challenge, we strongly recommend testing it in a Free Trial first.
Once you master it, you’ll have a strategy that offers great results with minimal effort — without spending hours glued to your trading platform.


