
Market Sector Scanner: AI Stocks Lift Nasdaq to Record Highs as Gold Demand Surges Again
The impact of weak U.S. jobs data continued last week, while President Trump’s new tariffs—including a 39% duty on Swiss gold—pushed gold higher. U.S. stocks climbed on AI optimism. With key U.S. inflation and retail sales data ahead, plus looming trade deadlines, the market is looking to the data for the next trend.

Markets spent the week reacting to weak U.S. jobs data and new tariff announcements. President Trump set new tariffs on several countries, including a 39% duty on Swiss gold exports to the U.S., which increased demand for gold. U.S. stocks bounced back, helped by strong technology shares on AI optimism and solid company earnings, while U.S. PMI data came in better than expected, giving some support to the dollar despite pressure from the jobs numbers. In the UK, the Bank of England cut interest rates by 0.25% as expected, but the close vote lifted the pound. Investors also watched the search for the next Fed Chair, expected to support lower interest rates. The dollar fell during the week but recovered to finish near its highs.
Scan for opportunities on:
Key Events Calendar for August 11 – August 15
Market Sector Scanner
Forex Market
USD/JPY
Last Week Recap:
USD/JPY tested lower last week as the shock of poor U.S. employment data encouraged sellers. However, support levels held, and improving risk sentiment saw the market recover to close the week with a small gain.
Technical Picture:
Prices are now sitting in the middle of the Bollinger Bands, and with the 10-day moving average pointing sideways, the market is likely to remain range-bound in the near term.
Outlook This Week:
Key U.S. inflation and retail sales data will be the main drivers of direction this week. Range trading remains the best strategy unless the data come in significantly different from expectations, which could trigger a breakout move.
GBP/JPY
Last Week Recap:
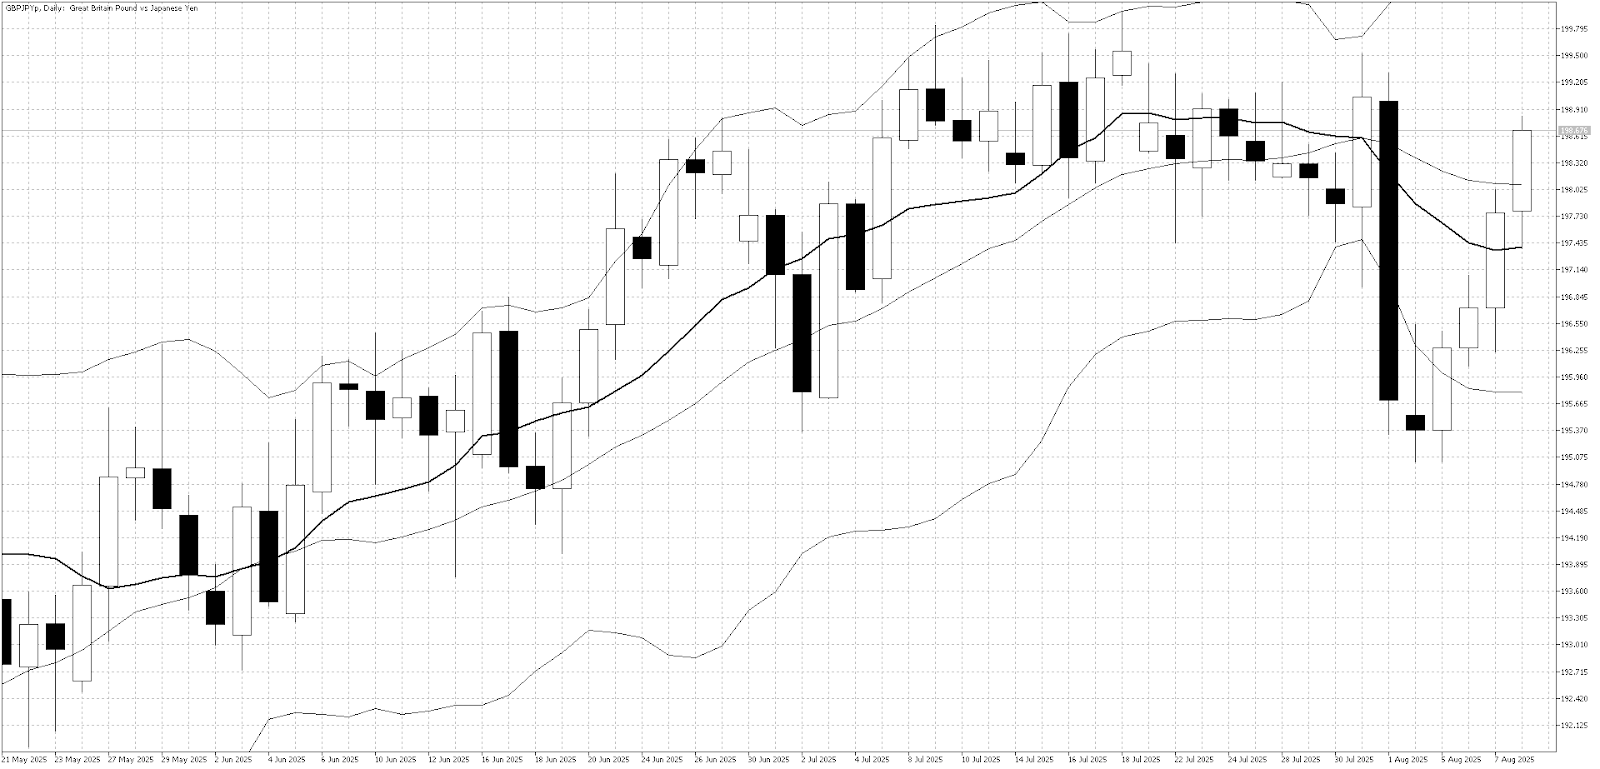
GBP/JPY had a surprisingly strong week as the Bank of England’s 0.25% rate cut was opposed by more policymakers than expected, encouraging buying. Persistently high UK inflation also fueled speculation that further rate cuts may be limited, adding support to the pair.
Technical Picture:
Last week, the Bollinger Bands provided support, prompting speculative buying, and the close above the 10-day moving average helped halt the recent downward momentum.
Outlook This Week:
Further gains from current levels may be difficult, with strong resistance still seen at the 200 level. The market is likely to test slightly lower this week, with Thursday’s UK GDP release in focus as the next potential driver.
EUR/USD
Last Week Recap:
Expectations of lower U.S. interest rates saw EUR/USD edge higher in quiet trading conditions. The market is anticipating that the gap between U.S. and European interest rates will continue to narrow, supporting the euro.
Technical Picture:
EUR/USD has moved back to the middle of the Bollinger Bands and climbed above the 10-day moving average, suggesting a sideways bias in the short to medium term.
Outlook This Week:
This week’s focus will be on U.S. inflation data, which could influence how quickly the Federal Reserve may lower interest rates—potentially strengthening EUR/USD. Range trading remains the preferred approach, with traders looking to follow momentum after the U.S. inflation data releases.
Equities
U. S. Stock Market
Last Week Recap:
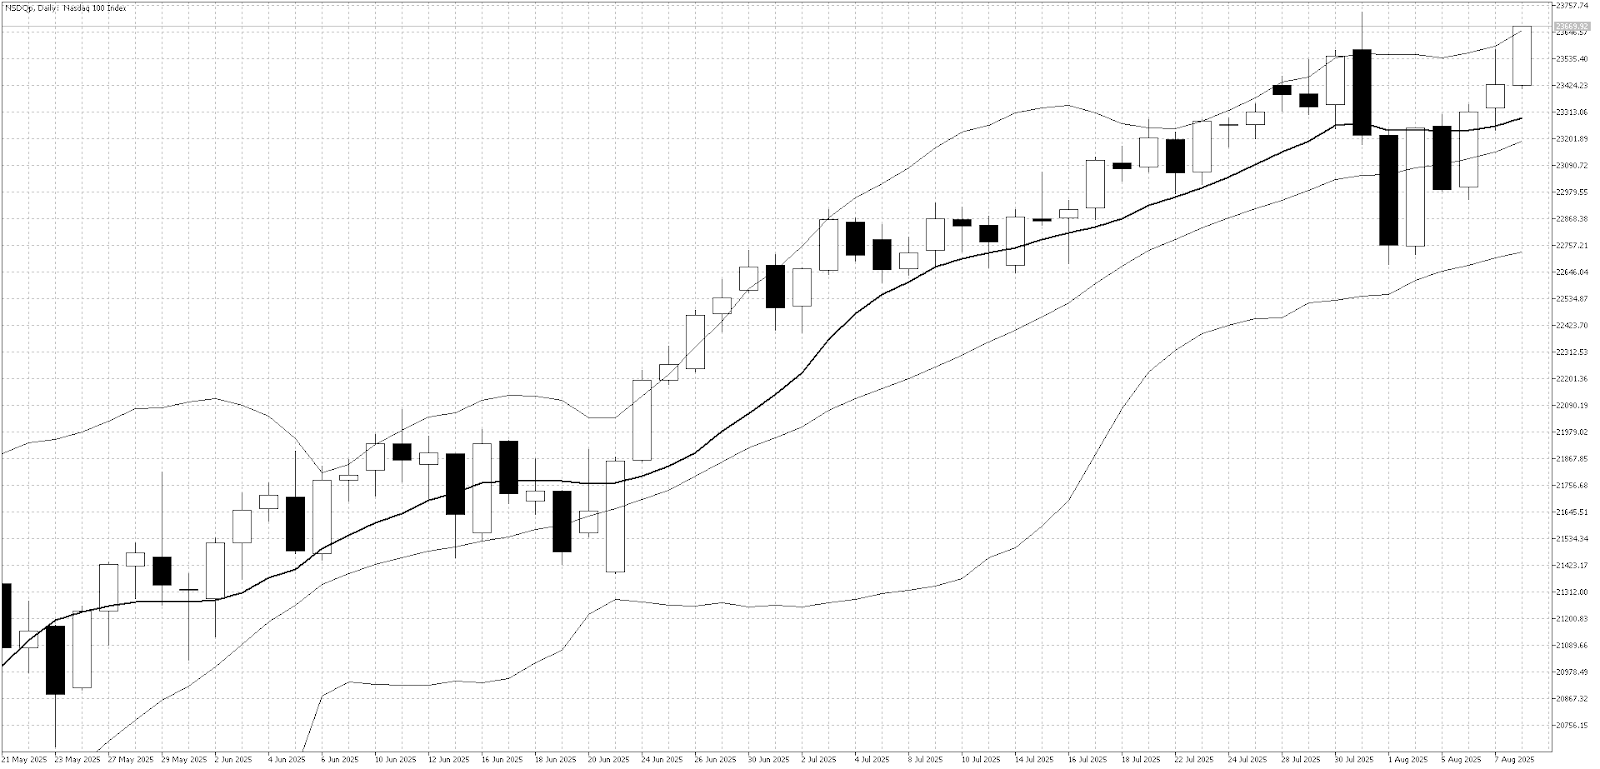
The Nasdaq resumed its strong uptrend as interest in AI-related stocks stayed high, quickly erasing losses from the U.S. employment data and hitting new record highs. Strength in Apple, Nvidia, Tesla, and Microsoft helped push the index higher, while expectations of U.S. interest rate cuts also supported U.S. equities.
Technical Picture:
The index has returned to the upper Bollinger Band, which may act as short-term resistance. However, with the 10-day moving average starting to point higher again, support appears strong on the downside.
Outlook:
The Nasdaq remains in strong demand despite the implementation of new U.S. tariffs. The market views the shift of more production back to the U.S. as a positive, keeping the medium-term outlook bullish. In the short term, traders may look to buy on periods of weakness.
Commodities
Gold
Last Week Recap:
Gold rose strongly last week as hopes for lower U.S. interest rates and ongoing trade tensions boosted buying. Prices got an extra lift after the U.S. announced tariffs of up to 39% on some Swiss gold bars, sending futures to record highs.
Technical Picture:
The 10-day moving average is rising, showing strong momentum. The upper Bollinger Band is just above current prices and may act as short-term resistance.
Outlook This Week:
Gold is still moving within the $3,250–$3,450 range but looks ready to test higher. Buying on dips remains the best strategy.
Markets are watching developments around the next U.S. Federal Reserve Chair, as President Trump looks to influence interest rate policy, while also keeping a close eye on the U.S.–China trade deadline on August 12, with no agreement yet to extend the 90-day tariff truce. Any headlines on trade could quickly shift sentiment. At the same time, key U.S. economic data—particularly inflation and retail sales—are expected to have a big impact on market direction. With last week’s price action stuck in a range, the combination of political news, trade deadlines, and major data releases could make this an active week with plenty of short-term trading opportunities.


