
Market Sector Scanner – Markets Rally on Strong Earnings as Dollar Recovers. Tariff Risks Still in Focus
The U.S. dollar extended its rebound as President Trump eased pressure on the Fed. Stocks hit record highs on upbeat earnings and soft inflation data, while gold and oil remained range-bound. With the August 1 tariff deadline approaching, traders are watching U.S. trade talks, central bank updates, and key global economic indicators for direction.

The U.S. dollar continued its recovery as President Trump eased pressure on the Federal Reserve to cut interest rates. Gold traded sideways but remained supported at lower levels, while crude oil prices dipped slightly as Middle East tensions eased, reducing supply concerns. The S&P 500 and Nasdaq reached new record highs, supported by strong corporate earnings and positive economic data. U.S. inflation (CPI and PPI) came in below expectations, suggesting that recent tariff increases have not yet impacted consumer prices. U.S. retail sales and consumer sentiment also beat forecasts, giving markets an additional boost.
Scan for opportunities on:
Key Events Calendar for July 21 – 25
Market Sector Scanner
Forex Market
USD/JPY
Last Week Recap:
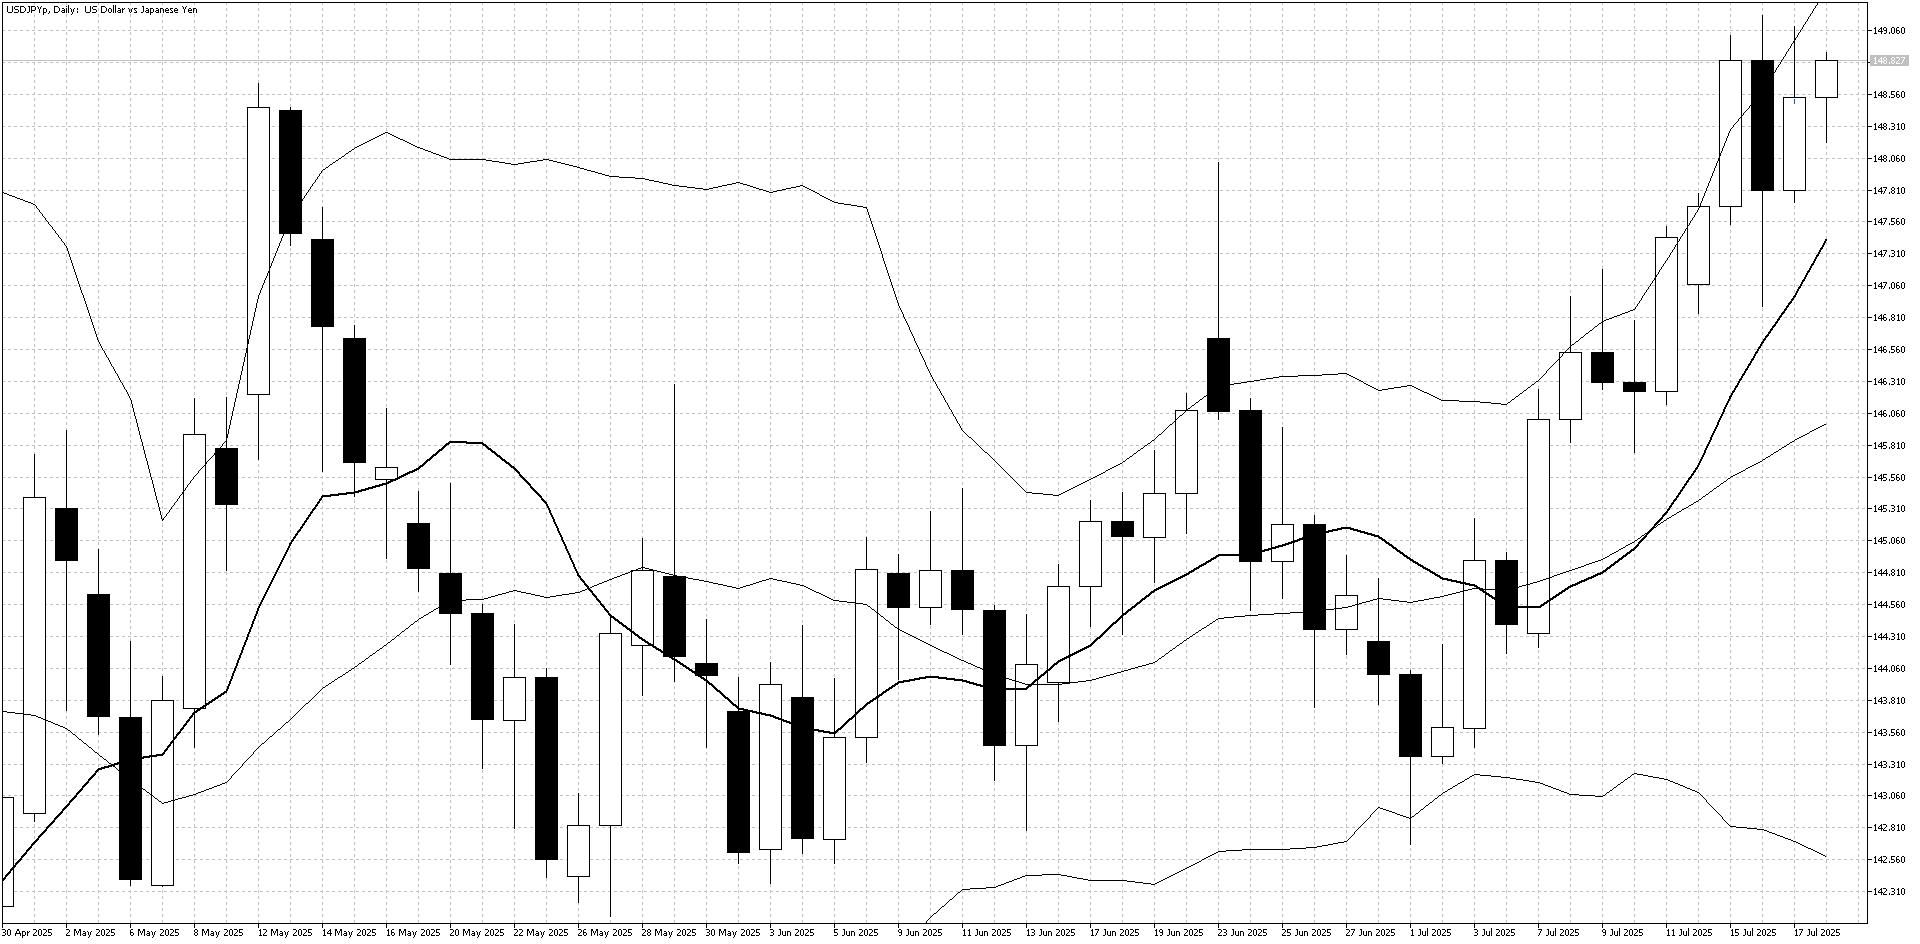
USD/JPY had another strong week, as concerns that new U.S. tariffs could hurt the Japanese economy made it more difficult for the Bank of Japan to consider raising interest rates. This led to continued yen selling and steady demand for the dollar throughout the week.
Technical Picture:
The upper Bollinger Band continues to act as short-term resistance, with price testing this level several times. However, the medium-term uptrend remains solid, supported by a sharply rising 10-day moving average — a sign that buyers remain in control.
Outlook This Week:
Although the pair is trading near key resistance levels, some sideways movement or minor pullbacks are possible in the short term. That said, the broader trend remains bullish, and buying on weakness continues to be the preferred strategy for traders.
GBP/JPY
Last Week Recap:
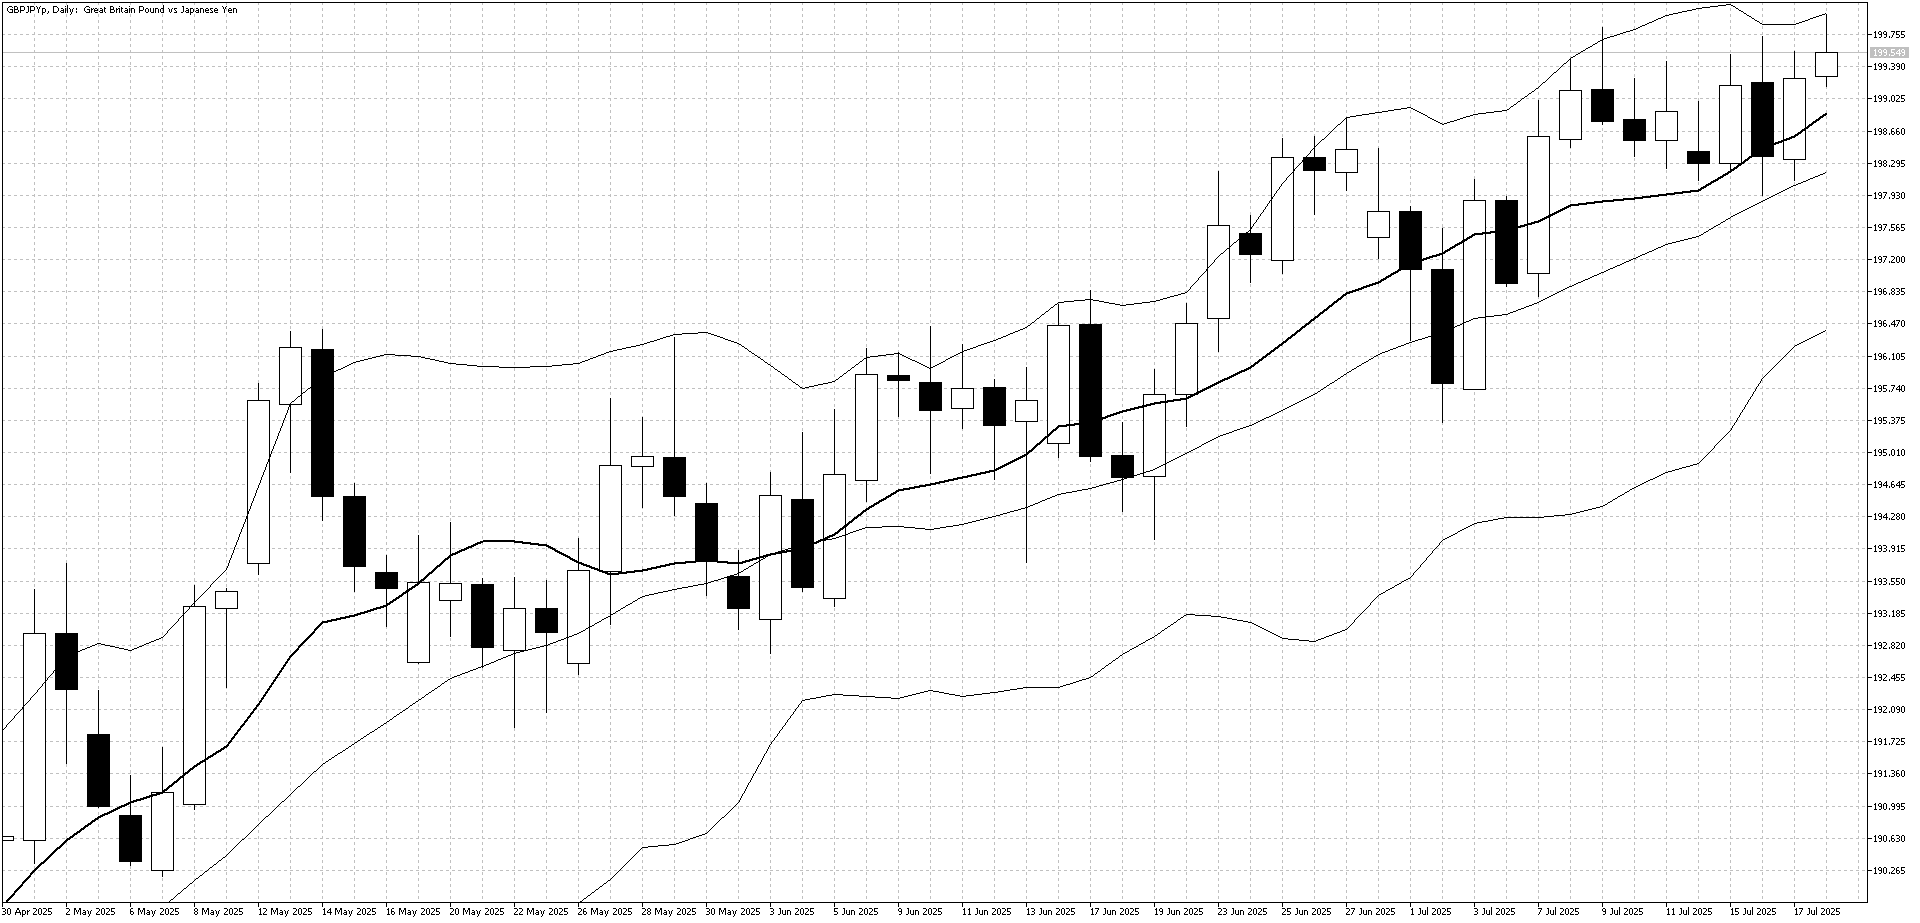
GBP/JPY moved higher last week, supported by ongoing yen weakness and a slight upside surprise in U.K. inflation data. These factors helped the pair push toward the key 200 level, though a clear breakout was not achieved.
Technical Picture:
The upper Bollinger Band was tested multiple times, and resistance at the 200 level prompted traders to take profits on strength. Still, the overall uptrend remains intact, with the 10-day moving average continuing to slope upward and guide the market higher.
Outlook This Week:
Yen weakness is expected to persist, making dips toward the 10-day moving average attractive buying opportunities. In both the short and medium term, the strategy of buying on pullbacks remains favored as long as the broader trend stays bullish.
EUR/JPY
Last Week Recap:
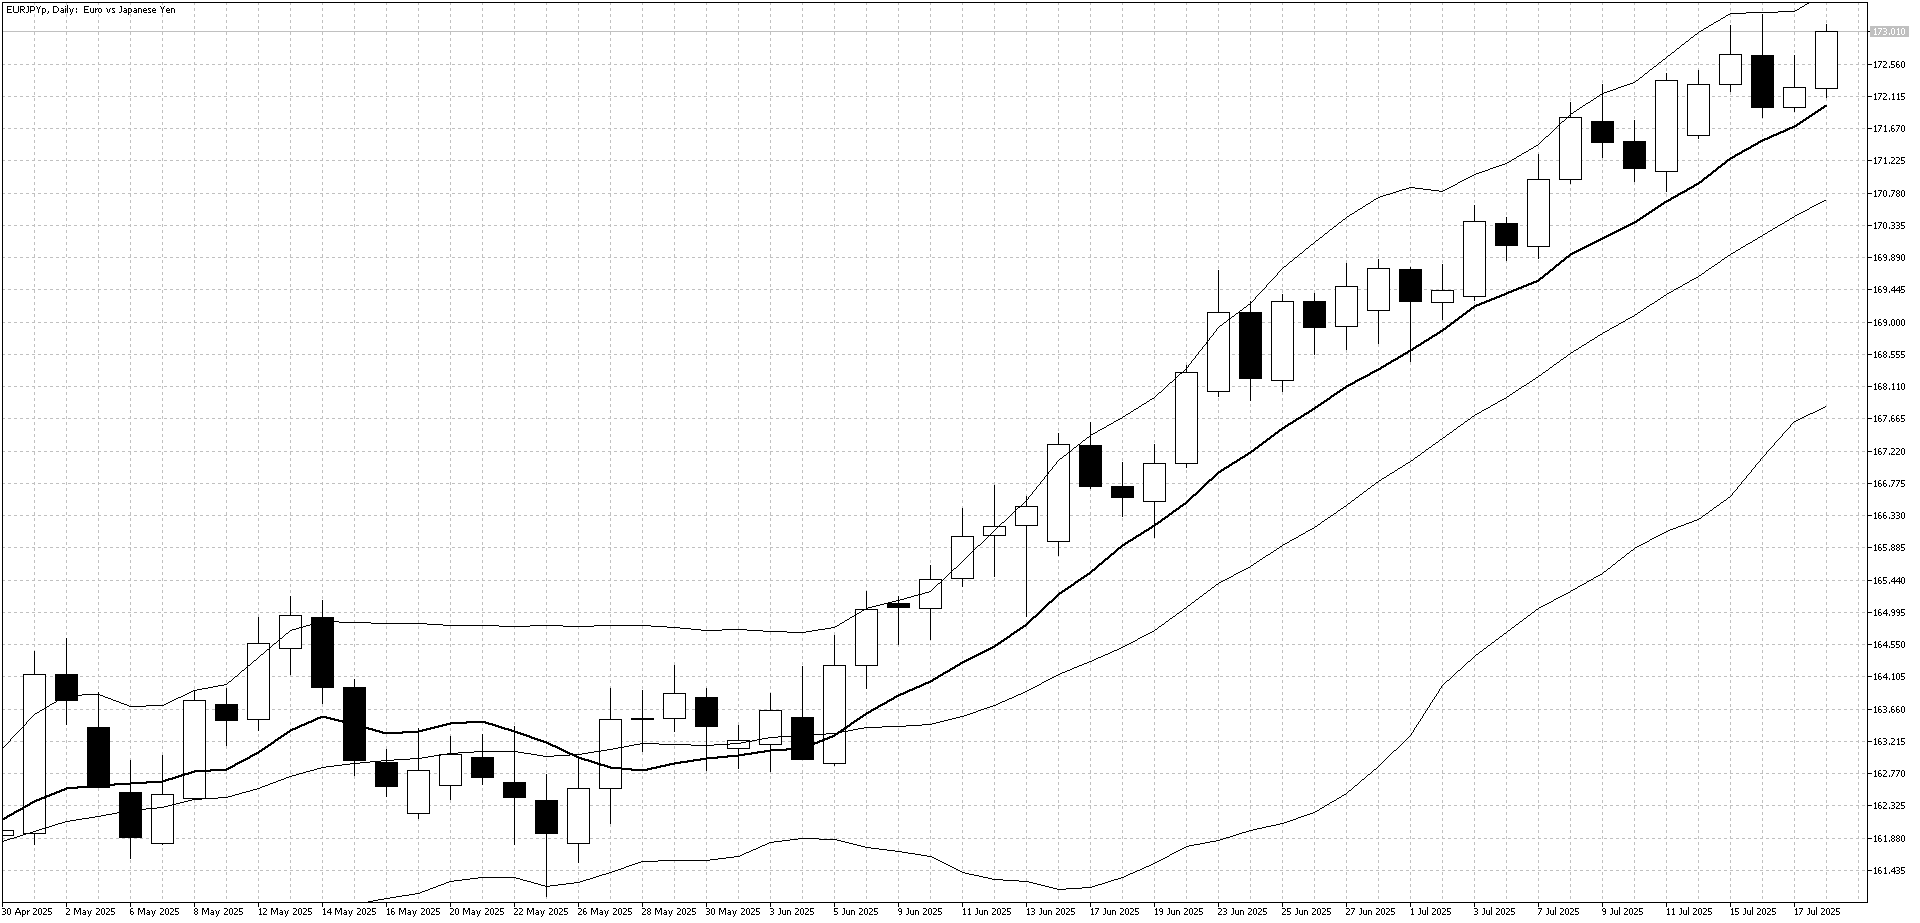
EUR/JPY recorded yet another weekly gain, supported by strong buying on the back of continued yen weakness and better-than-expected European economic data. The pair remains firmly in an uptrend as bullish sentiment continues to dominate.
Technical Picture:
EUR/JPY continues to find solid support at the rising 10-day moving average, which has helped guide the uptrend. Gains, however, are being capped by the upper Bollinger Band, which is acting as short-term resistance in an otherwise strong market.
Outlook This Week:
In the short term, following the uptrend remains the preferred strategy as long as the pair stays above the 10-day moving average. For medium-term traders, a break below this level could offer a better risk–reward setup to consider selling.
AUD/JPY
Last Week Recap:
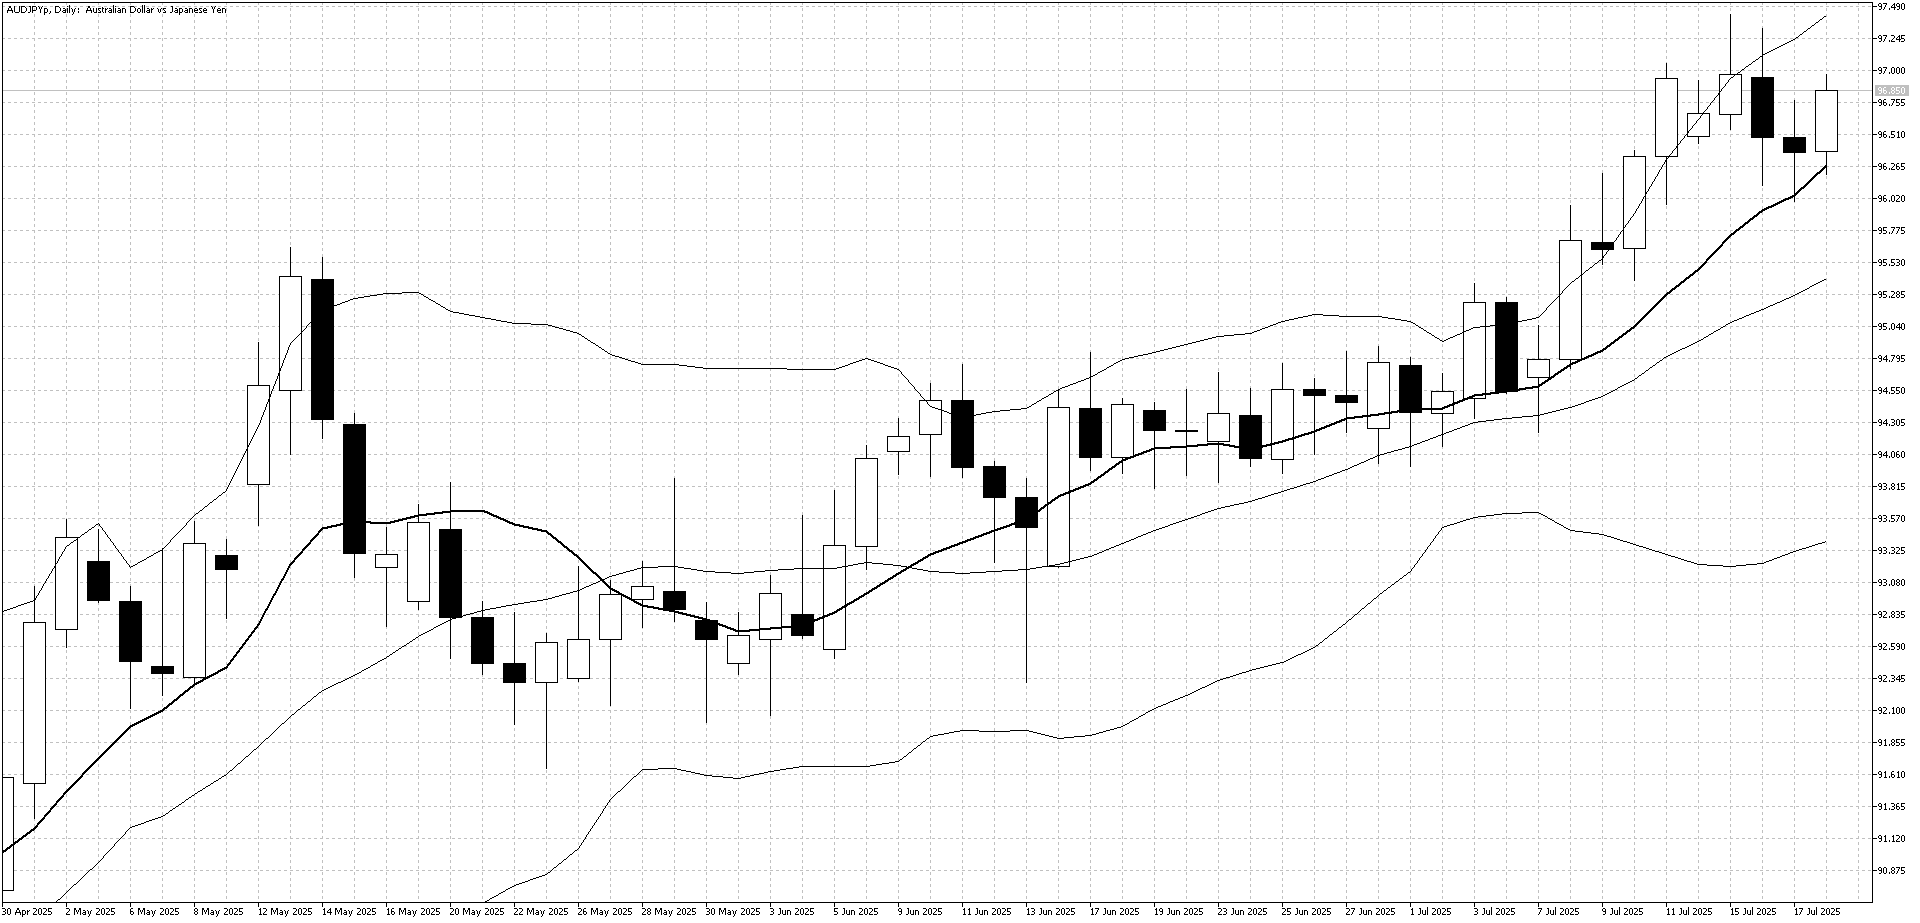
AUD/JPY started the week strong but faced profit-taking after the upper Bollinger Band acted as resistance. However, renewed yen selling toward the end of the week brought buyers back in, reinforcing the current uptrend.
Technical Picture:
The pair successfully bounced off the 10-day moving average, which is a positive sign for bullish momentum. This level continues to offer support and gives buyers confidence to maintain their positions in AUD/JPY.
Outlook This Week:
Following the current short-term uptrend remains the preferred strategy. However, with overall volatility still low, selling near the upper Bollinger Band may provide favorable short-term opportunities for range traders.
NZD/JPY
Last Week Recap:
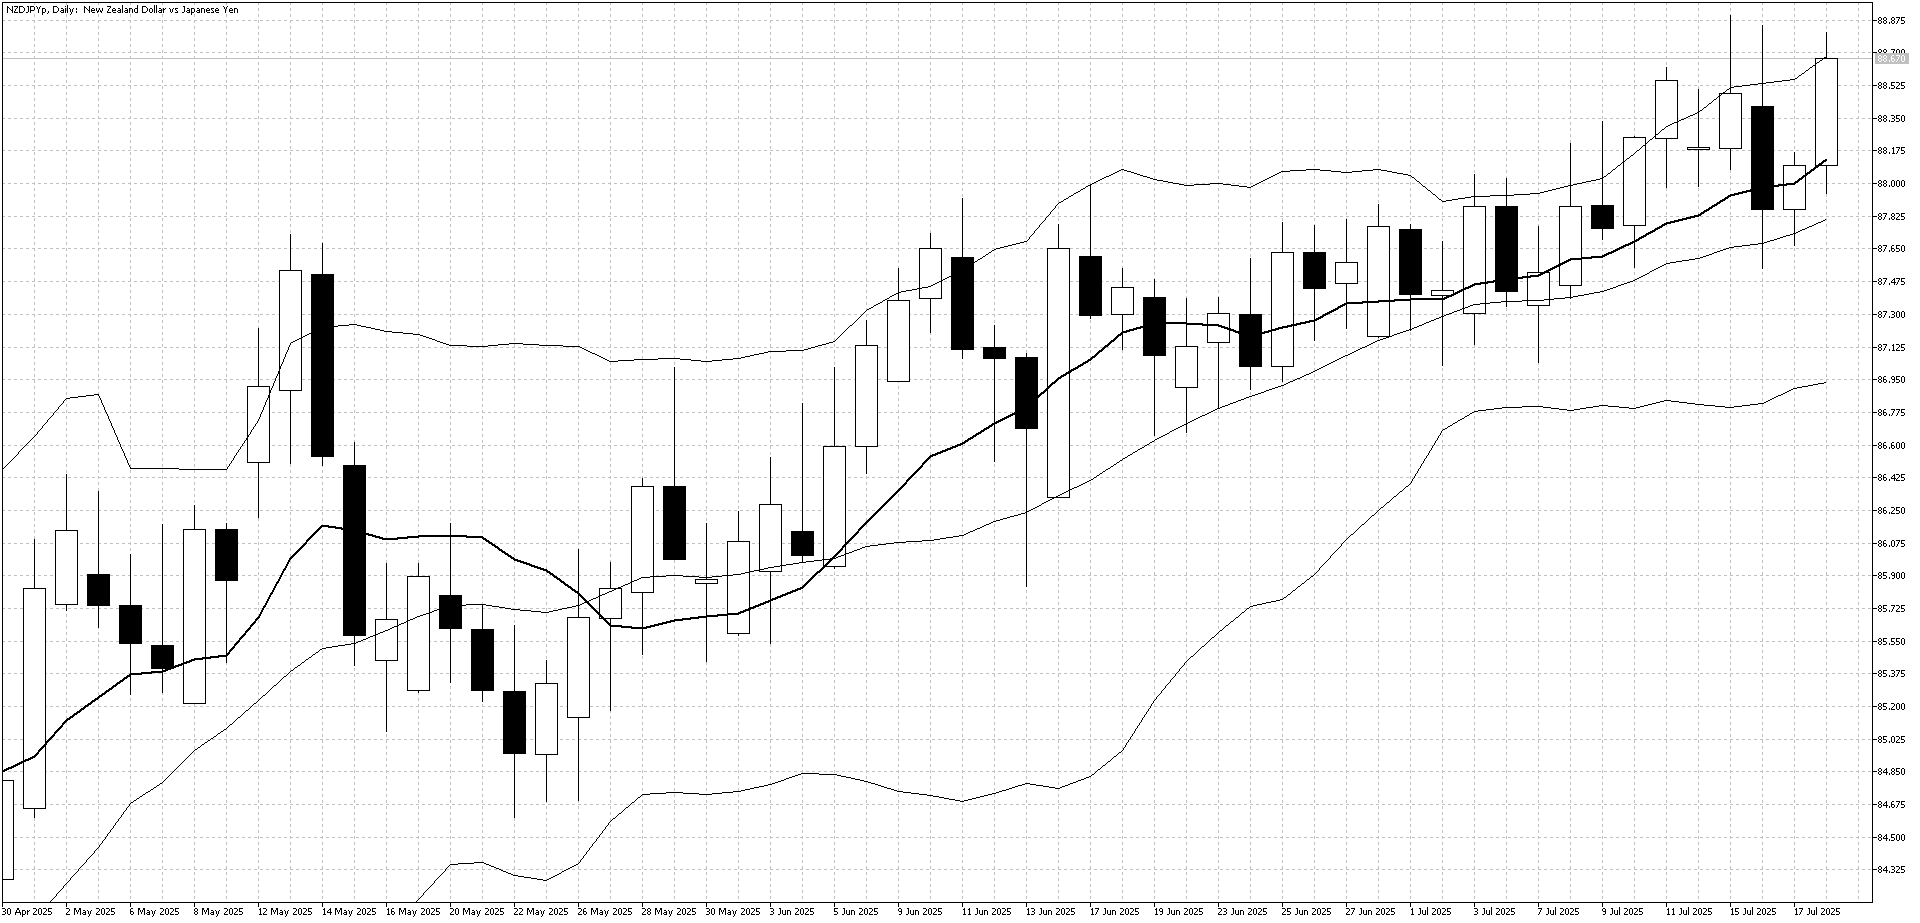
NZD/JPY spent much of last week consolidating its recent gains, trading sideways as the previous resistance at the 88 level began to act as support. The market lacked momentum but held its ground within a stable range.
Technical Picture:
The upper Bollinger Band continues to act as resistance, while overall volatility remains low. However, upward momentum is gradually building as the 10-day moving average maintains a steady upward slope, supporting the ongoing uptrend.
Outlook This Week:
With volatility still subdued, NZD/JPY may remain a challenging market for short-term traders. For medium-term traders, however, the trend remains positive, and continuing to follow the uptrend and look for higher levels remains the favored approach.
EUR/USD
Last Week Recap:
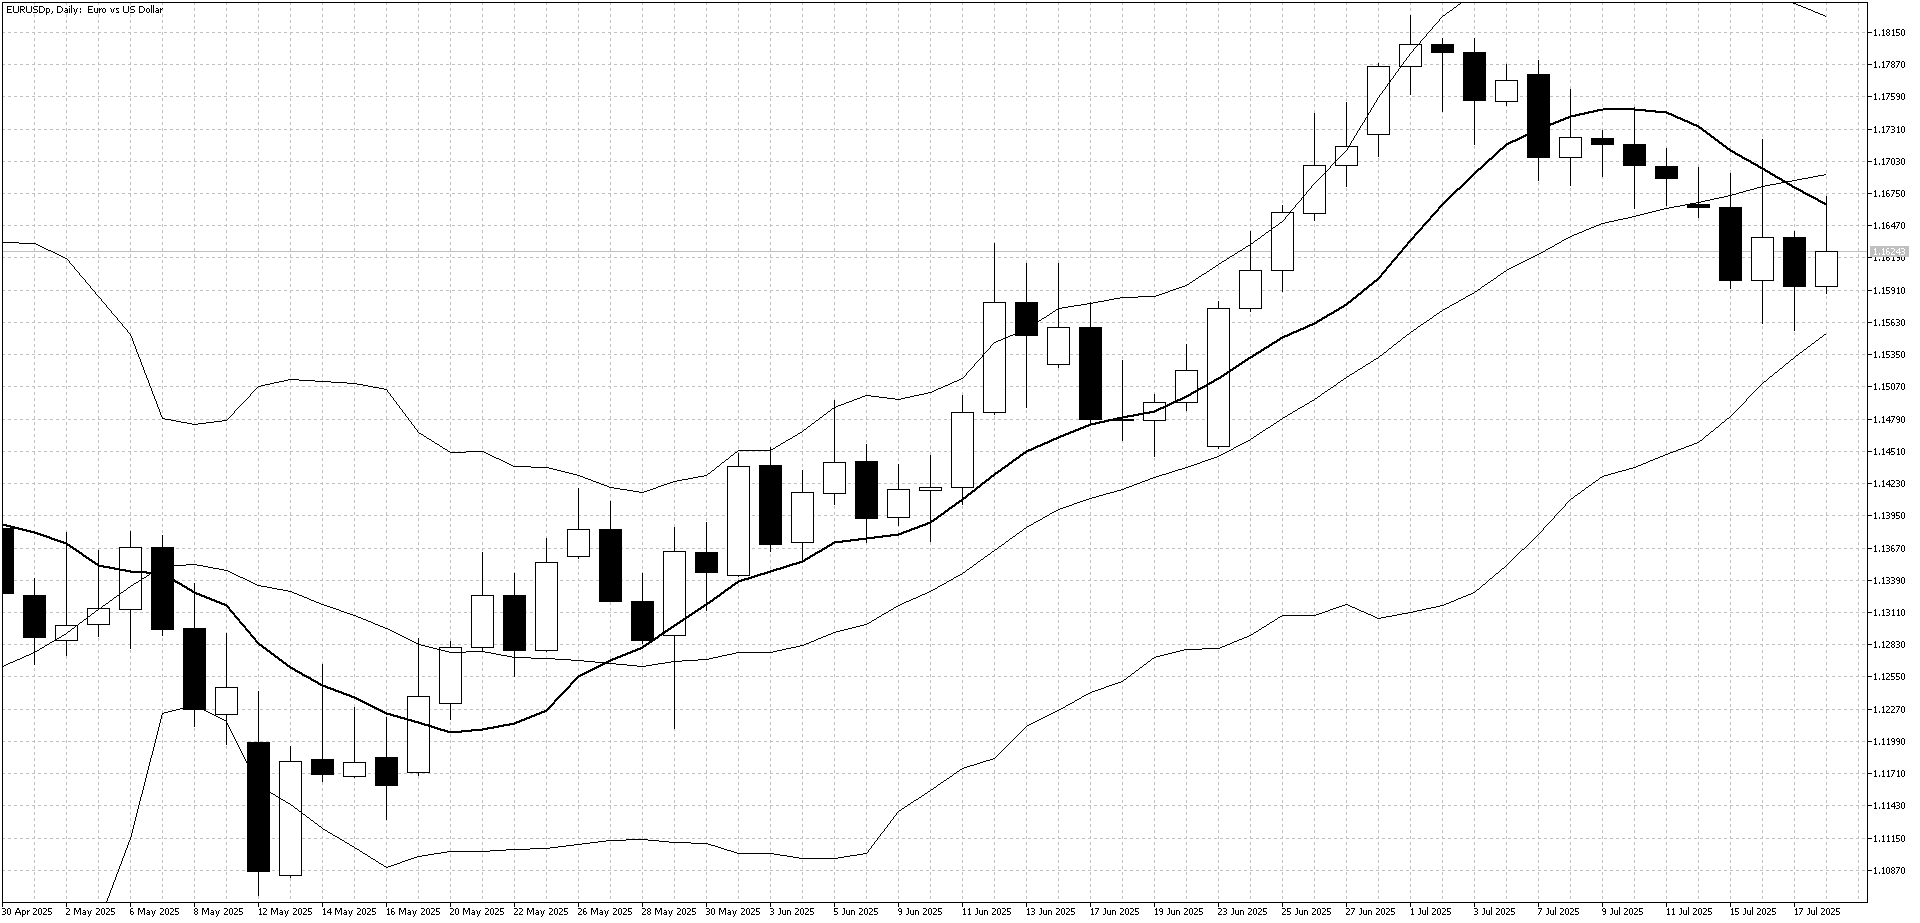
EUR/USD continued to decline last week as the U.S. dollar strengthened on expectations of higher inflation driven by tariffs and cautious signals from the Federal Reserve regarding future rate cuts. This combination of factors weighed on the euro and extended the recent downtrend.
Technical Picture:
The 10-day moving average continued to slope downward, reinforcing the bearish momentum and pressuring the pair lower. Attention now turns to the lower Bollinger Band, which may be tested in the coming days and could act as initial support.
Outlook This Week:
EUR/USD appears likely to remain under pressure ahead of Thursday’s ECB meeting, where interest rates are expected to be held steady. Further downside testing is possible, and traders will be watching for potential support near key technical levels.
GBP/USD
Last Week Recap:
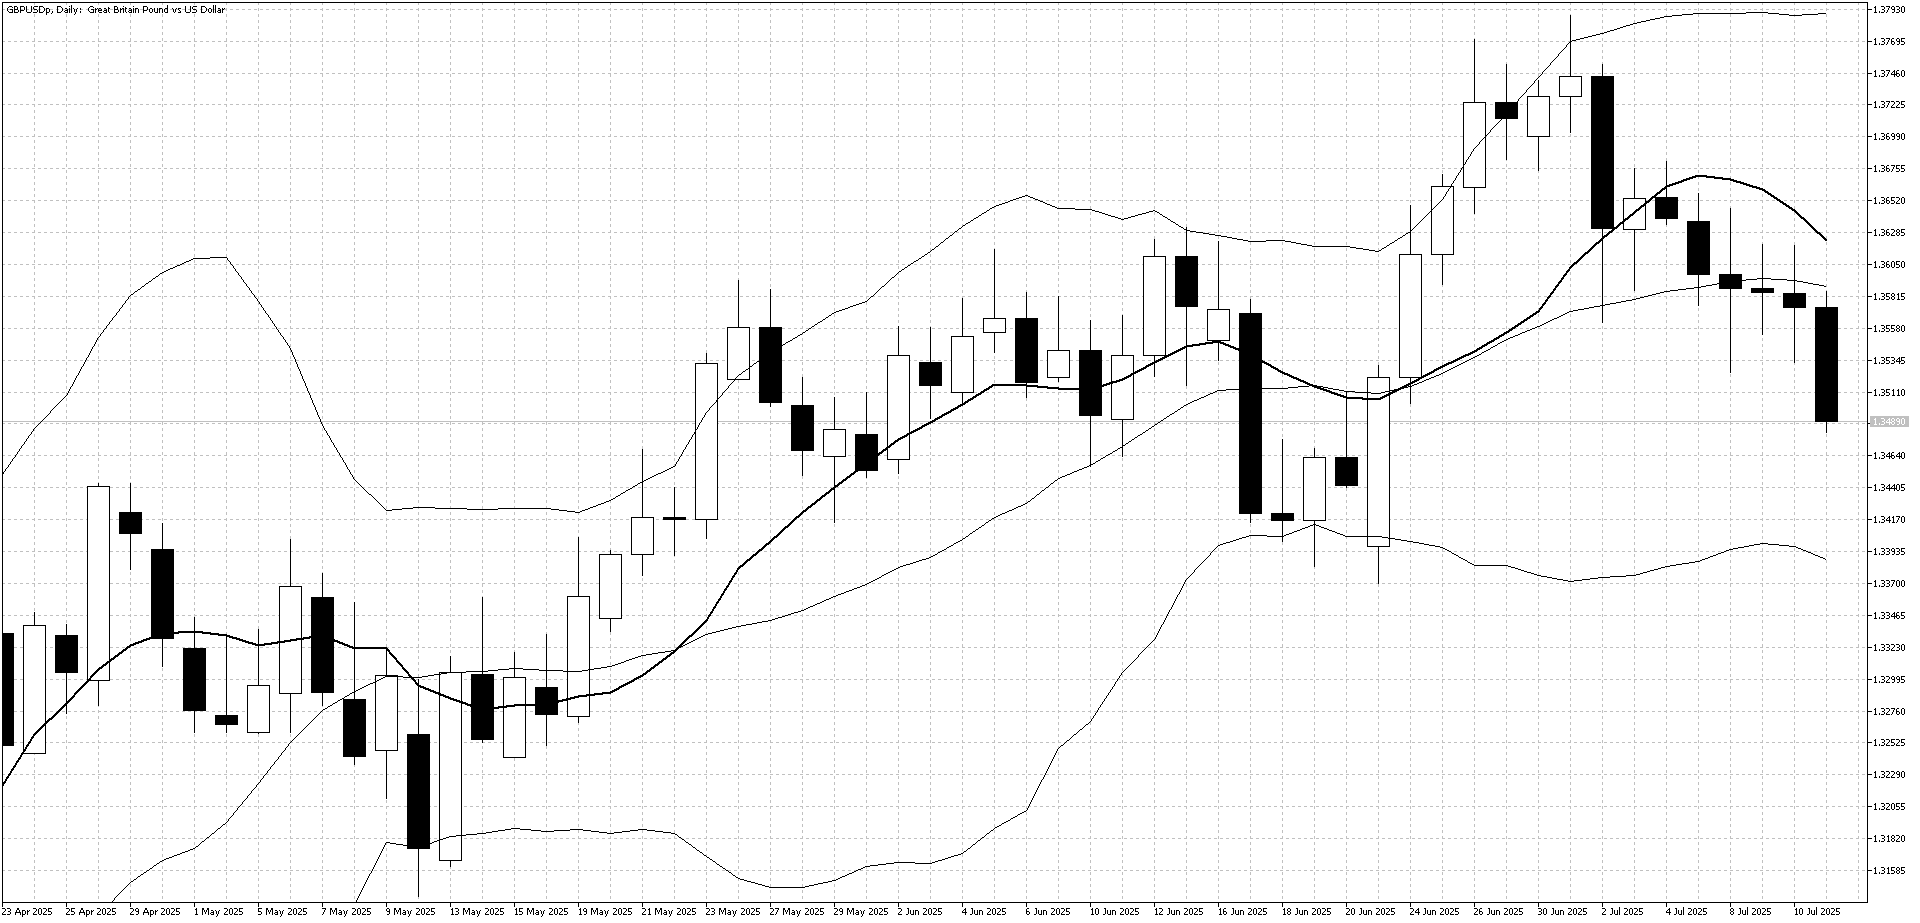
GBP/USD remained under pressure last week as ongoing concerns about the U.K. economy, combined with stronger-than-expected U.S. economic data, kept the recent downtrend firmly in place.
Technical Picture:
The pair is currently finding support near the lower Bollinger Band and the June lows. However, with the 10-day moving average still sloping downward, overall market sentiment remains bearish, and downward pressure is likely to continue.
Outlook This Week:
With the U.S. dollar continuing to recover after steep losses earlier in 2025, selling into strength remains the preferred strategy for now. Unless key resistance levels are broken, the bearish trend is expected to persist.
Equities
U.S. Stock Market
Last Week Recap:
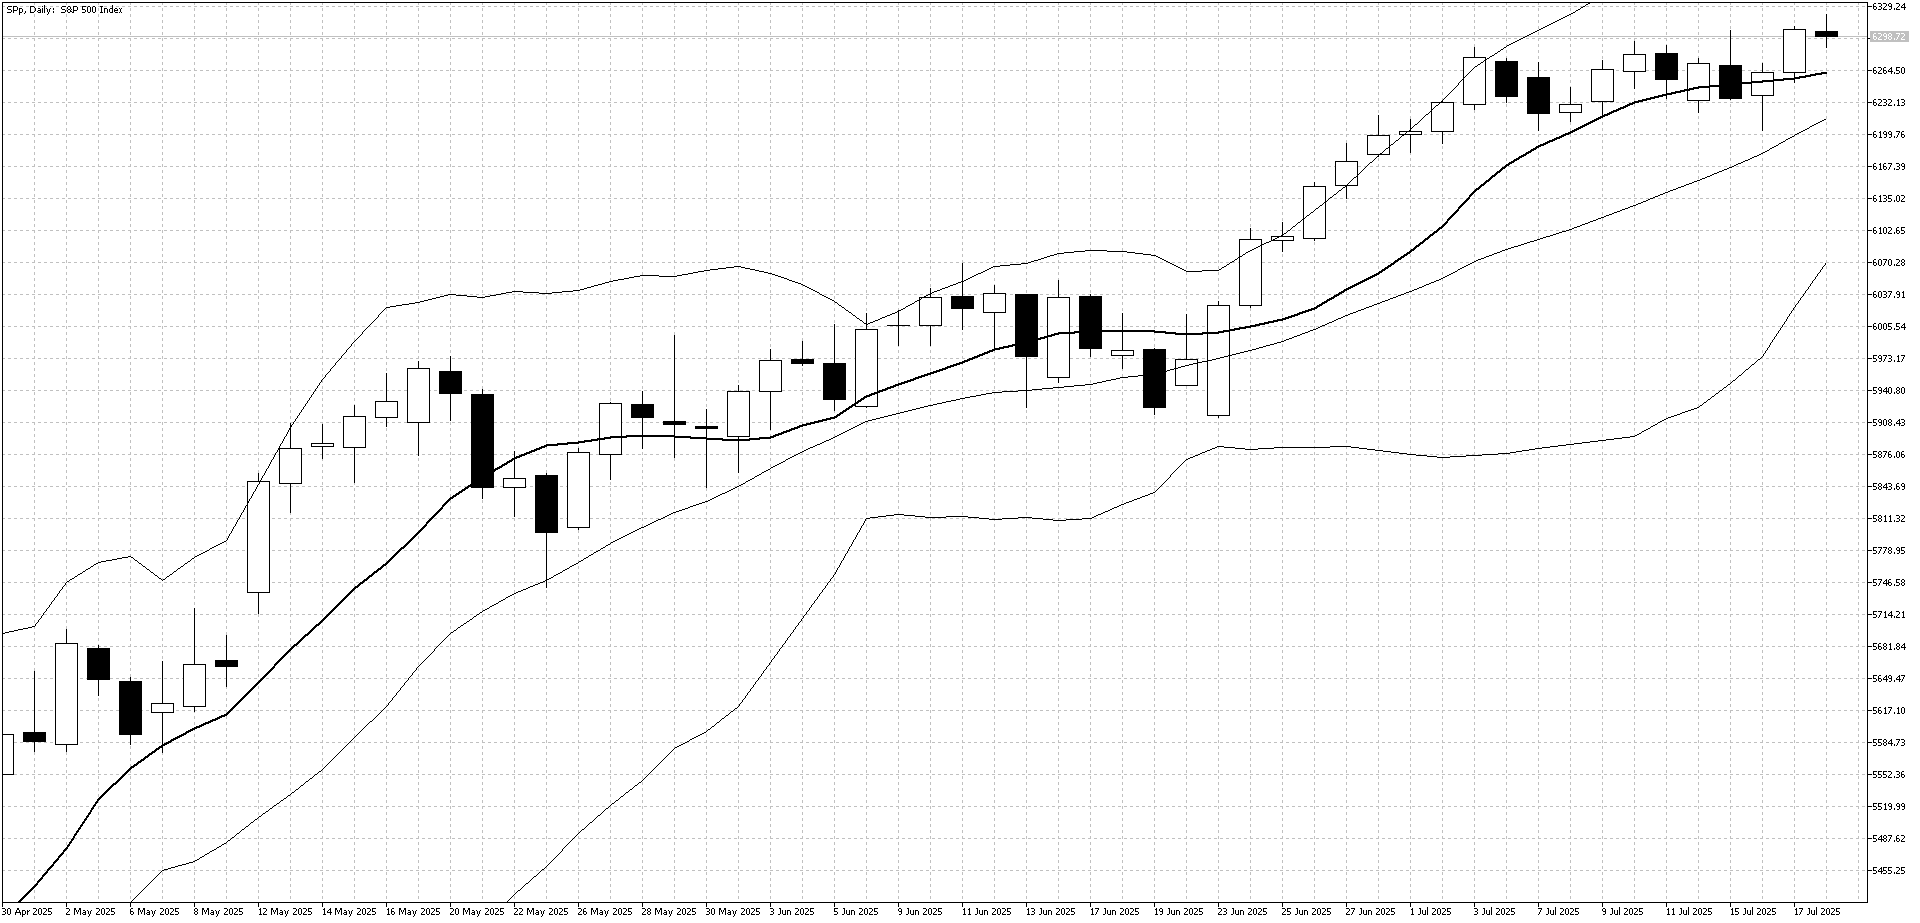
Strong U.S. corporate earnings, softer-than-expected inflation data, and better-than-forecast retail sales pushed the S&P 500 to new record highs last week. While investors remain aware of trade-related risks, the market appears more resilient and less concerned about the immediate impact of higher tariffs.
Technical Picture:
The S&P 500 ended the week above its 10-day moving average, confirming the strength of the recent uptrend. With Bollinger Bands widening and little resistance at current levels, upward momentum remains in place.
Outlook:
As the August 1 deadline for potential tariff adjustments approaches, the risk of negative headlines may increase. However, in the current environment, the path of least resistance still appears to be to the upside, and traders may continue looking for higher levels.
Japan Equities
Last Week Recap:
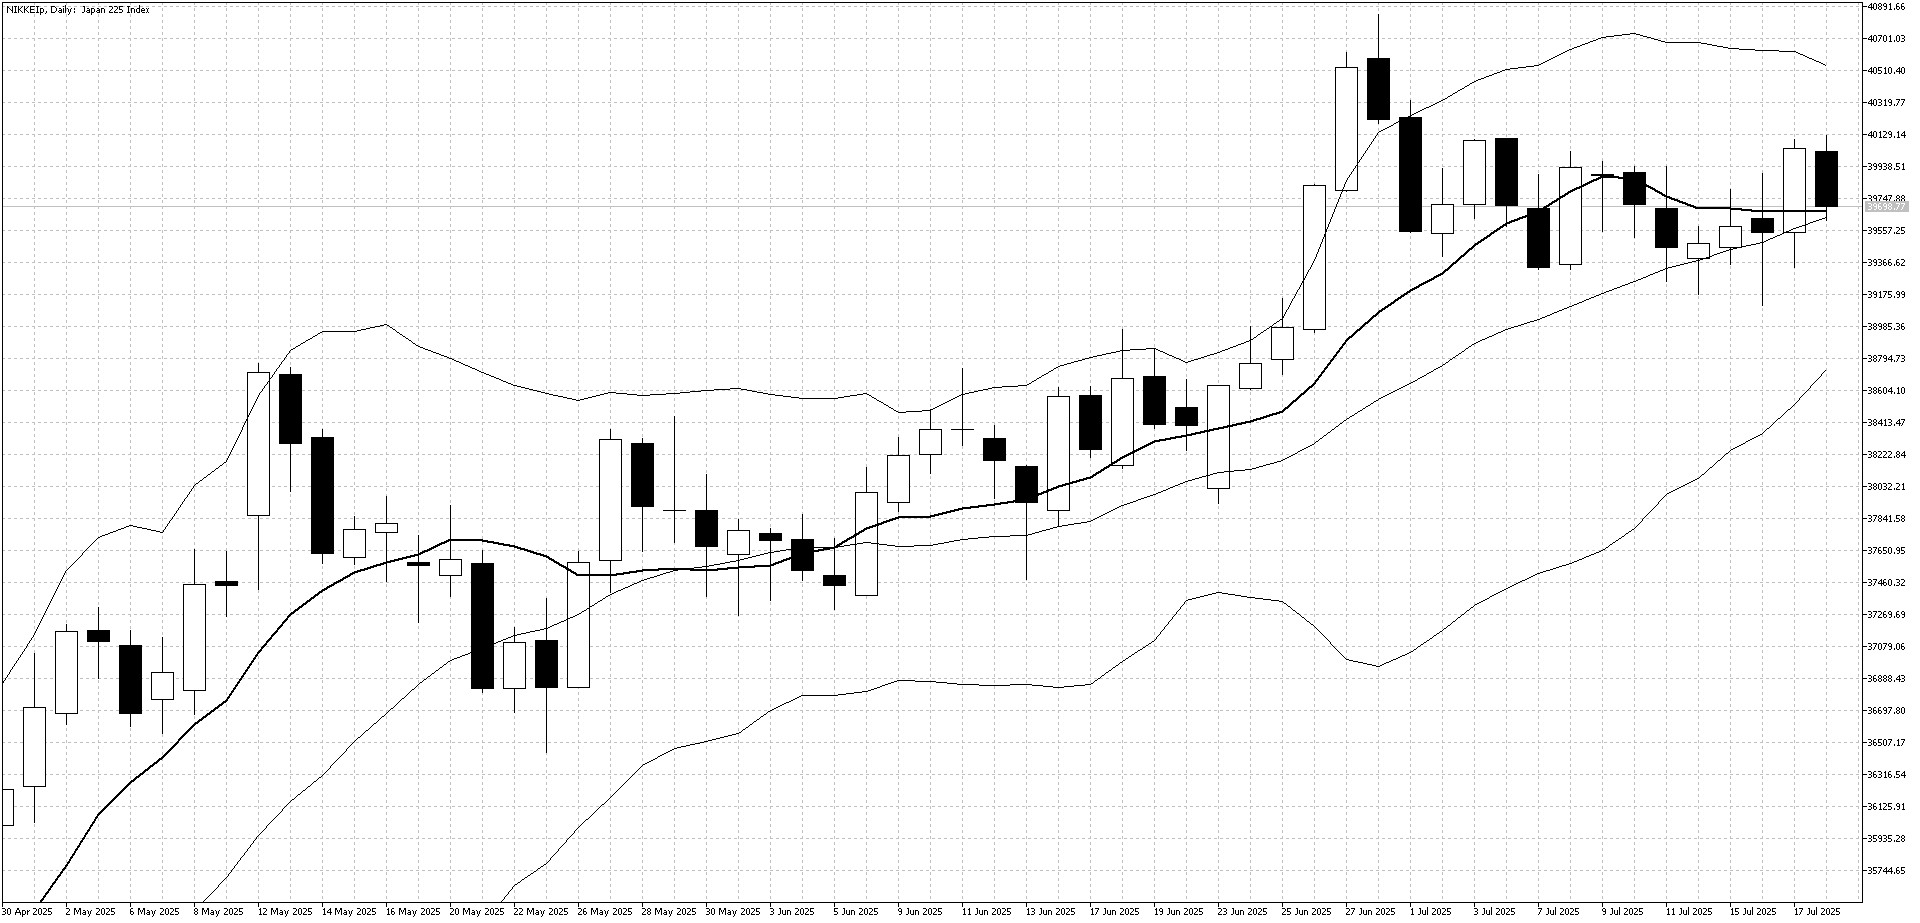
The Nikkei moved higher during the week, briefly testing the key 40,000円 resistance level, supported by strong U.S. equity performance and a weaker yen. However, concerns over stalled trade negotiations with the U.S. and uncertainty surrounding the upcoming Japanese election triggered a pullback ahead of the weekend.
Technical Picture:
The 10-day moving average is now flattening, suggesting a range-bound market in the short term. With Bollinger Bands narrowing, volatility is low, and the index is likely to take direction from developments in tariff negotiations and domestic political news this week.
Outlook This Week:
With the Nikkei still trading below the 40,000円 resistance level and risk sentiment fragile, focusing on selling opportunities appears to be the preferred strategy. Ongoing uncertainty around trade talks continues to weigh on the market outlook.
Commodities
Gold
Last Week Recap:
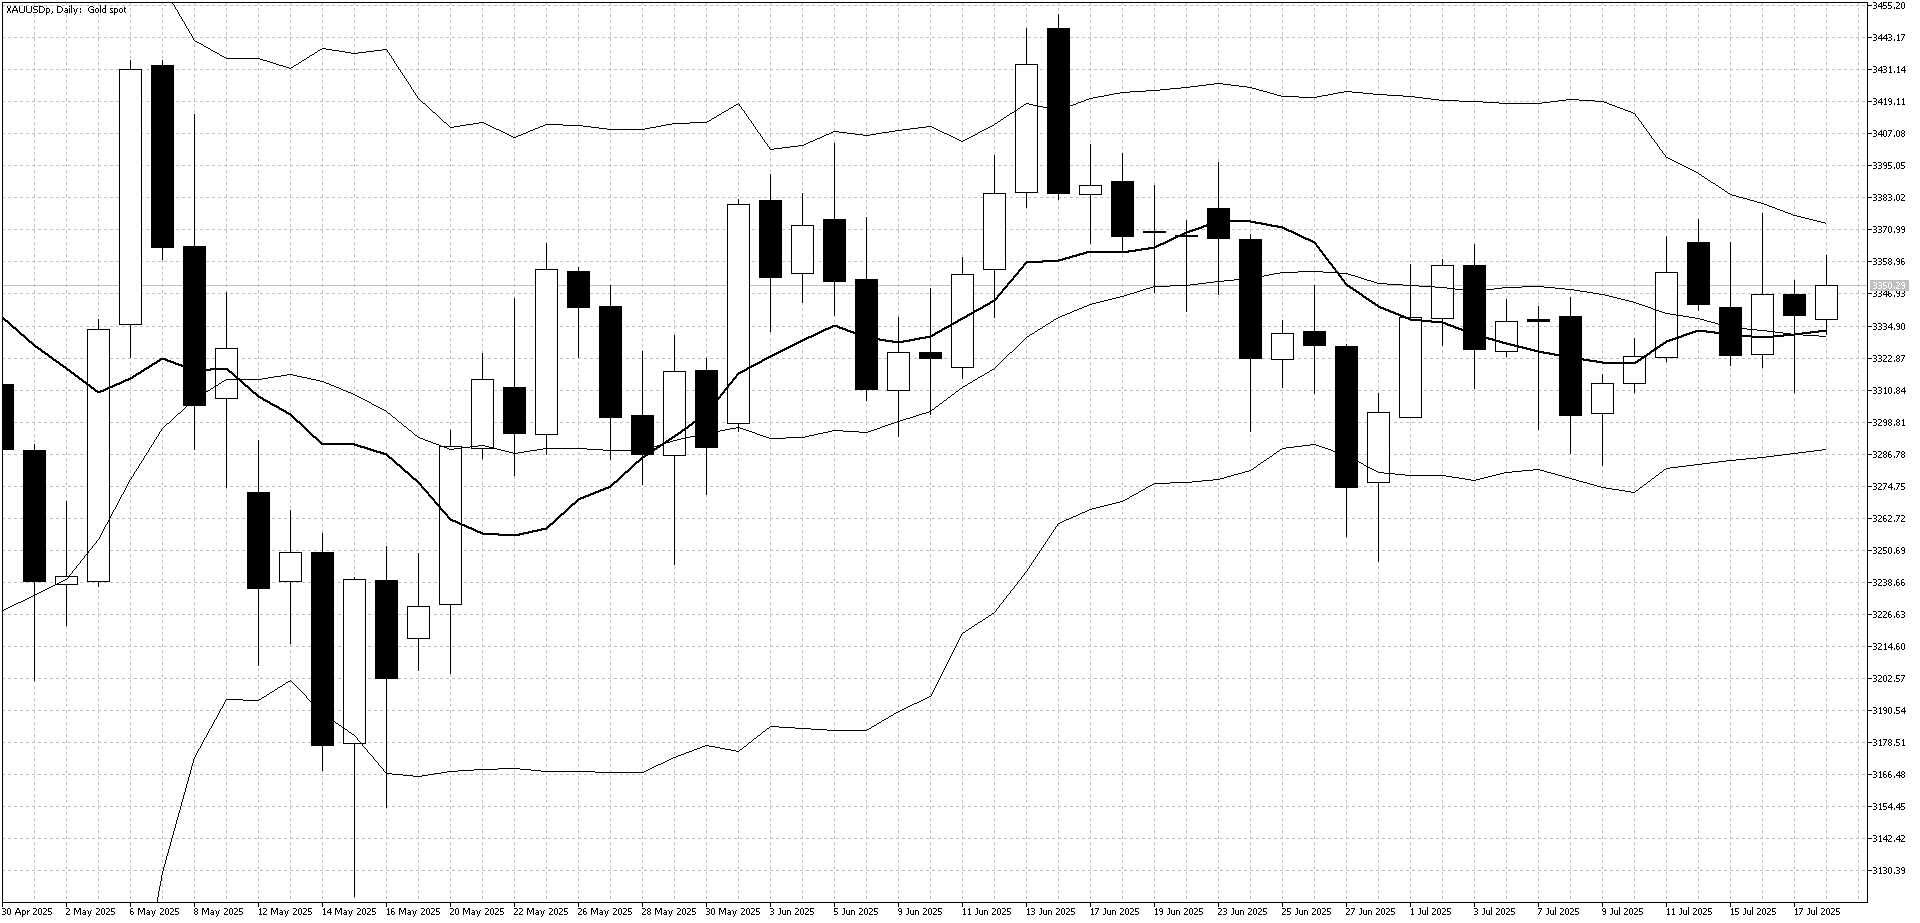
Gold traded sideways throughout the week as a stronger U.S. dollar prompted some profit-taking. However, this was offset by persistent buying interest at lower levels, keeping the market balanced and range-bound.
Technical Picture:
Bollinger Bands continue to narrow, reflecting reduced volatility as the market searches for direction. The 10-day moving average has flattened out, indicating that buyers and sellers are currently evenly matched.
Outlook This Week:
Range trading remains the preferred short-term strategy, with the market expected to remain between support at $3,250 and resistance at $3,400. With the August 1st tariff deadline approaching, traders may stay cautious, and the current range is likely to hold unless a major catalyst emerges.
Crude Oil
Last Week Recap:
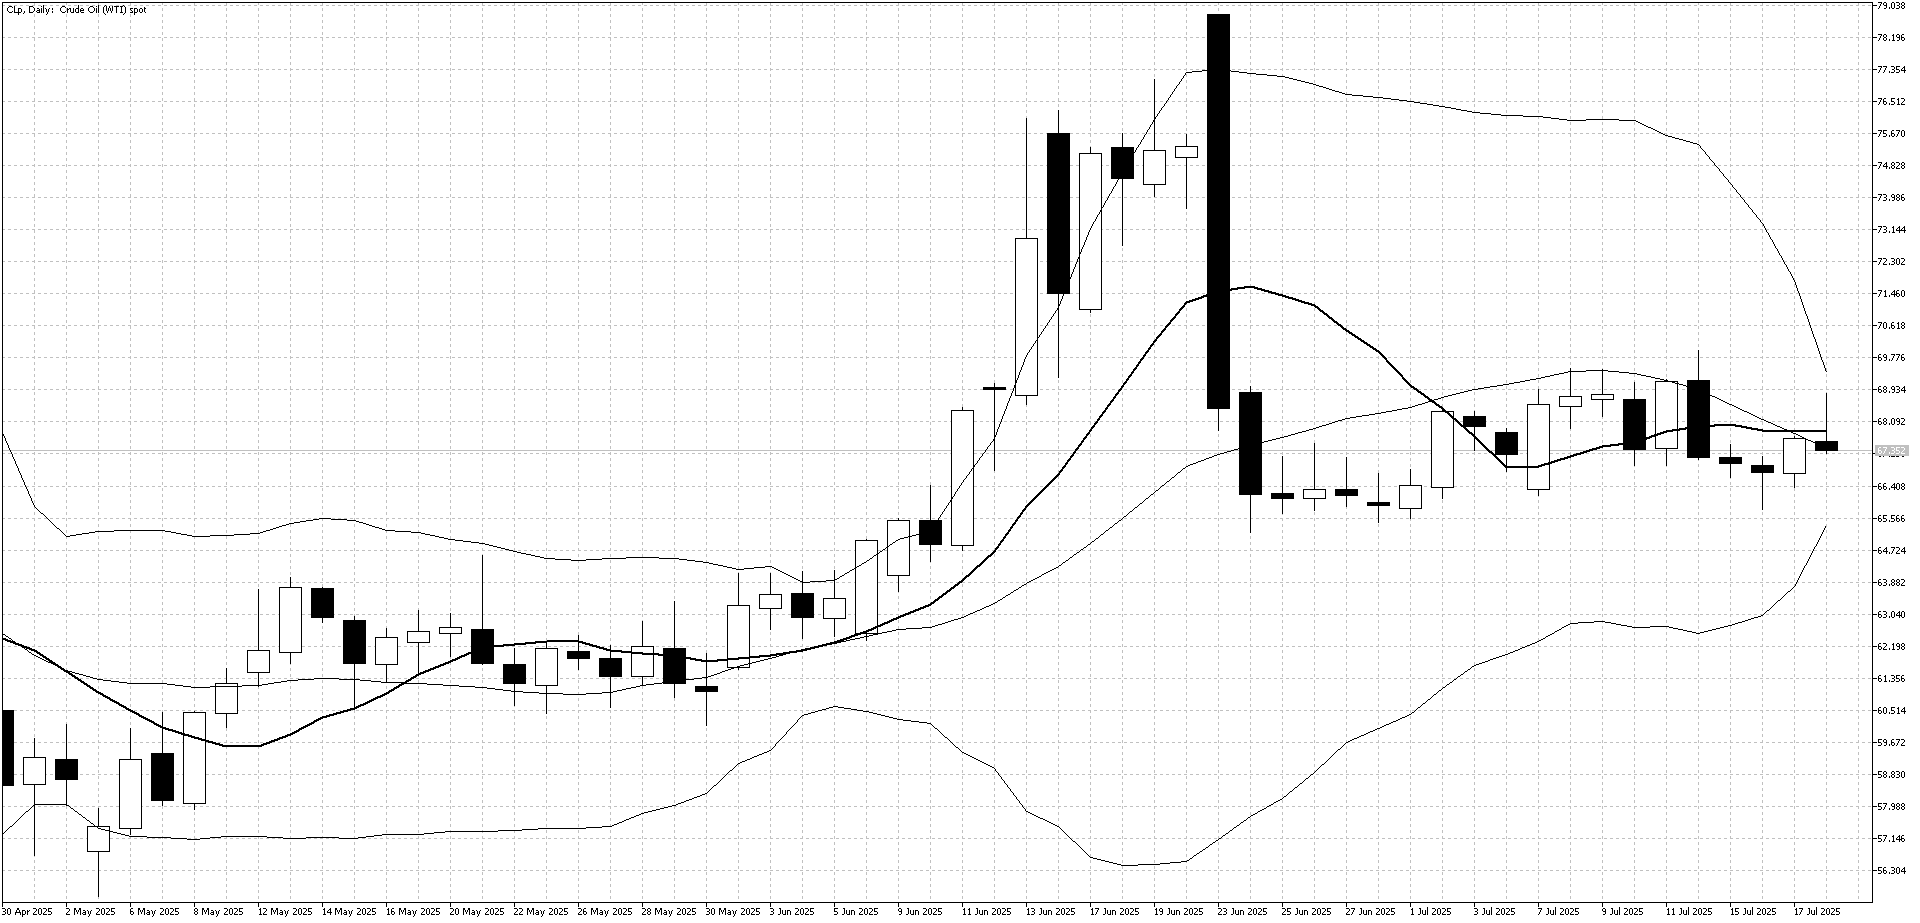
Crude oil had a relatively quiet week, with resistance near the $70 level prompting some selling, as Middle East tensions remained largely unchanged. On the downside, support at $65 held firm, bolstered by better-than-expected U.S. economic data.
Technical Picture:
Bollinger Bands have now narrowed and are aligning more closely with current price levels, which means they could serve as dynamic support and resistance zones in the week ahead.
Outlook This Week:
With no clear breakout yet, range trading between $65 and $70 remains the preferred short-term strategy. The market is likely to stay in this holding pattern until a new fundamental catalyst drives a directional move.
Ongoing U.S. trade negotiations remain a key focus for markets, especially talks with the EU and Japan. While investor sentiment is still optimistic, there have been no signs of real progress yet. In Japan, the results of the Upper House election will be closely watched and could lead to increased volatility in the yen and Nikkei index. The European Central Bank is expected to keep interest rates unchanged, shifting market attention to the speech following the decision. In addition, important economic data — including purchasing manager reports from Europe, the UK, and the U.S. — will be in focus. After a couple of quiet weeks, the chance of a surprise large move in the markets is increasing.


