
Market Sector Scanner – Israel’s attack shook the markets
Every week brings hundreds of trading opportunities - and we're here to help you spot the ones that matter. Market Sector Scanner articles highlight the hottest setups across Forex, metals, indices, and energies. Dive in, get inspired, and trade smarter. Your Market Sector Scanner for the week of June 16 - 20 is here.

It was a quiet week until Friday, with U.S.–China trade talks moving forward smoothly. Trump said he was open to extending the July 8 deadline if needed, but didn’t think it would be necessary.
U.S. inflation data (CPI and PPI) came in slightly above expectations, showing that price pressures remain high. The U.K. GDP was weaker than expected, but the British pound stayed strong.
Markets were calm for most of the week, but Friday’s news of Israel attacking Iran, followed by Iran’s retaliation, shook global markets. Oil and gold jumped, stocks fell, and in FX, most pairs moved sideways, though USD/JPY dropped sharply before bouncing back.
Scan for opportunities on:
Key Events Calendar for June 16 – 20
Market Sector Scanner
Forex Market
USD/JPY
Last Week Recap:
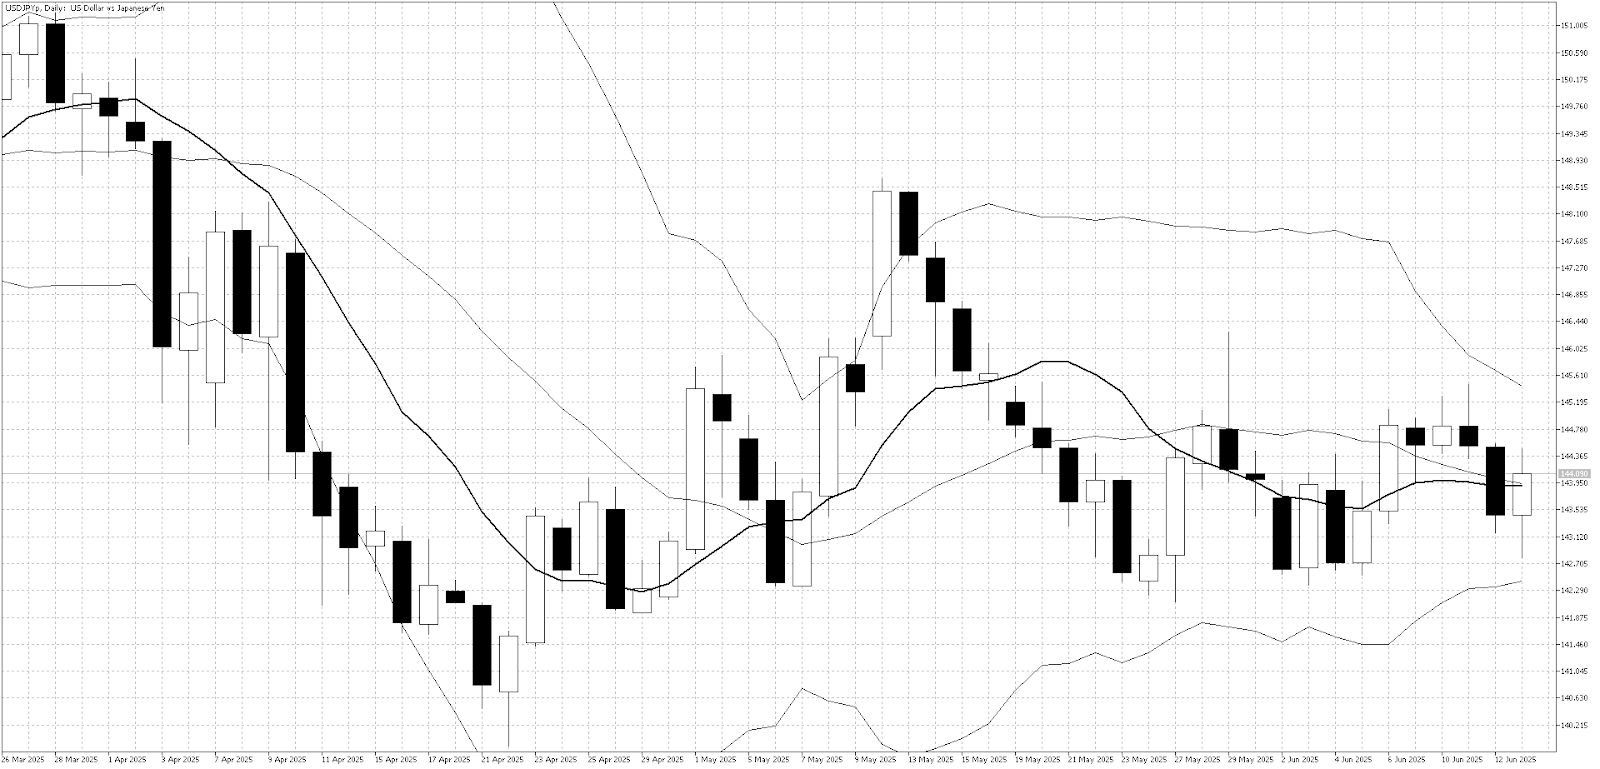
USD/JPY tried to push higher early in the week as improving risk appetite supported the dollar. On Friday, the pair dropped sharply when fighting broke out between Israel and Iran. However, strong buying quickly followed, as markets believe the Bank of Japan signaled it will delay interest rate hikes due to concerns over the impact of tariffs.
Technical Picture:
The sharp drop on Friday broke the recent upward momentum. The 10-day moving average has flattened, and Bollinger Bands have narrowed, signaling consolidation. USD/JPY continues to trade within a wide 142–146 range.
Outlook This Week:
Key signals for USD/JPY will come from the U.S. Federal Reserve and the Bank of Japan, both set to make announcements this week. A meeting between Trump and Ishiba at the G7 summit may also influence sentiment if progress is made on tariff discussions. While the pair remains range-bound, intraday moves have been strong and offer opportunities for trend-following strategies.
GBP/JPY
Last Week Recap:
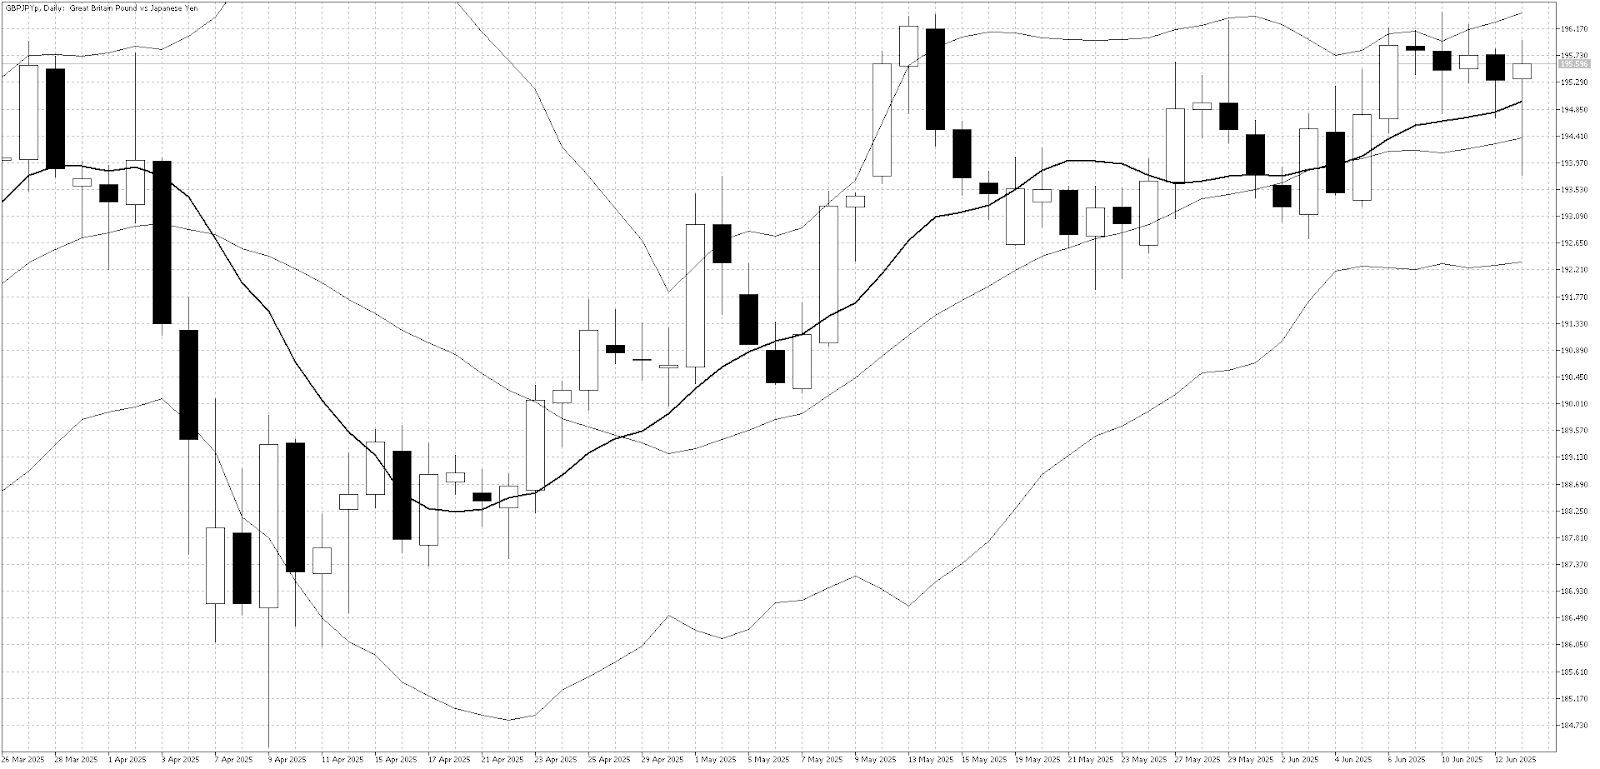
GBP/JPY continued to test resistance at 196 last week as risk-on sentiment remained strong for most of the week. Although the U.K. GDP came in weaker than expected, the broader trend of U.S. dollar weakness had a stronger influence on the pair. Tensions between Israel and Iran triggered a quick sell-off on Friday, but the dip was short-lived and well-supported.
Technical Picture:
The pair remains in a broad range between 190 and 196. However, the 10-day moving average is pointing higher, and the pair is not overbought on the Bollinger Bands, suggesting the 196 resistance level may be at risk of breaking in the near term.
Outlook This Week:
Short-term traders may still find selling opportunities near resistance at 196, but medium-term traders should be cautious about initiating new shorts and instead look to buy on dips.
EUR/JPY
Last Week Recap:
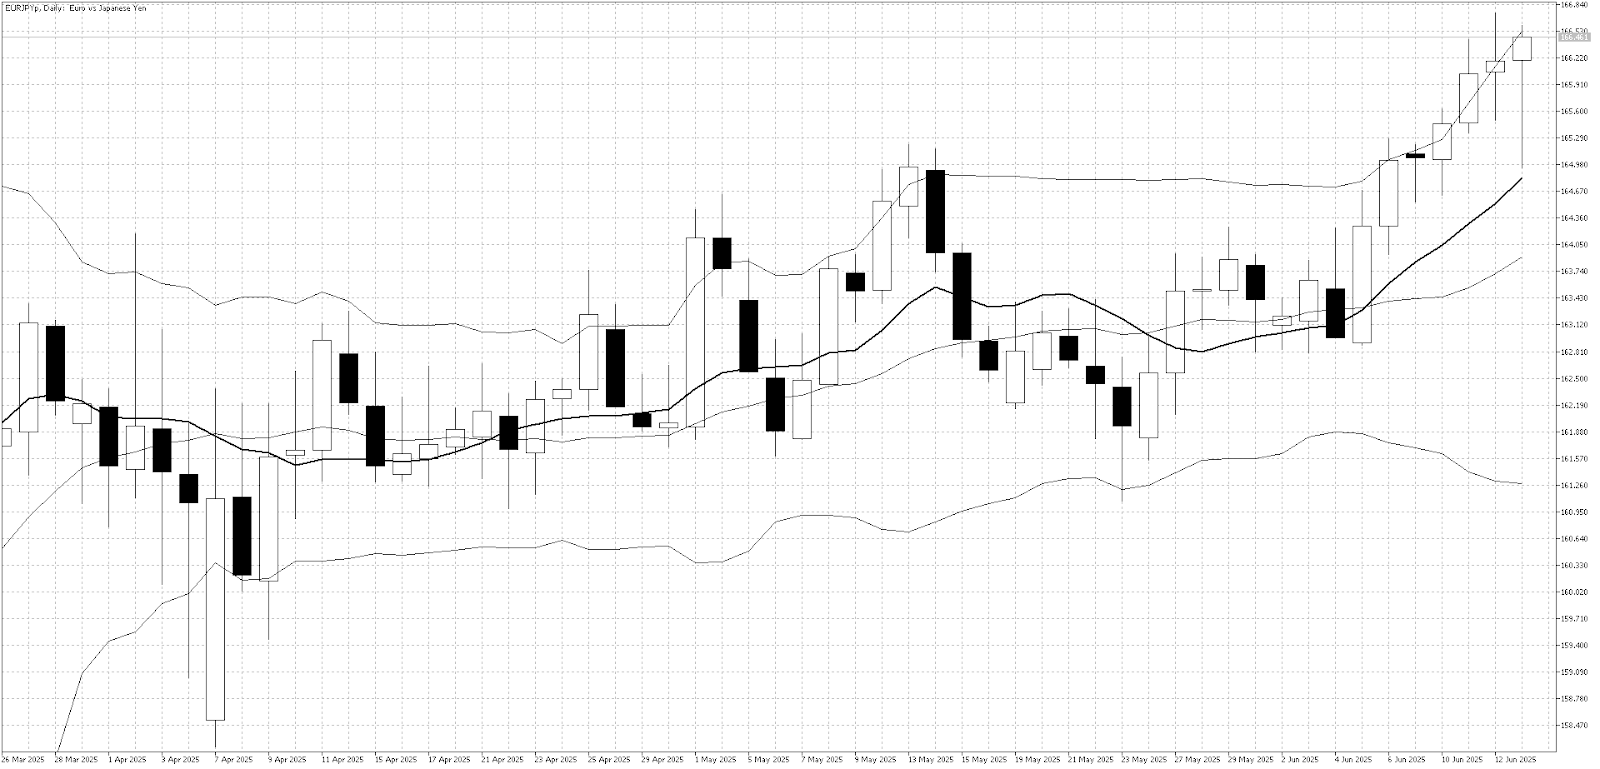
EUR/JPY continued its strong performance last week as the euro rallied. Although the market dipped on Friday due to renewed Middle East concerns, it held firm at the 165 level and the 10-day moving average—reinforcing the prevailing uptrend.
Technical Picture:
Technical indicators remain bullish. The 10-day moving average continues to trend higher, and the market is holding above the May highs at 165. However, the upper Bollinger Band is still acting as resistance, limiting further upside for now.
Outlook This Week:
While geopolitical concerns in the Middle East could trigger some selling pressure, the overall trend remains intact. As long as U.S.–China trade negotiations continue smoothly, the preferred strategy is to buy on dips, especially near key support levels.
AUD/JPY
Last Week Recap:
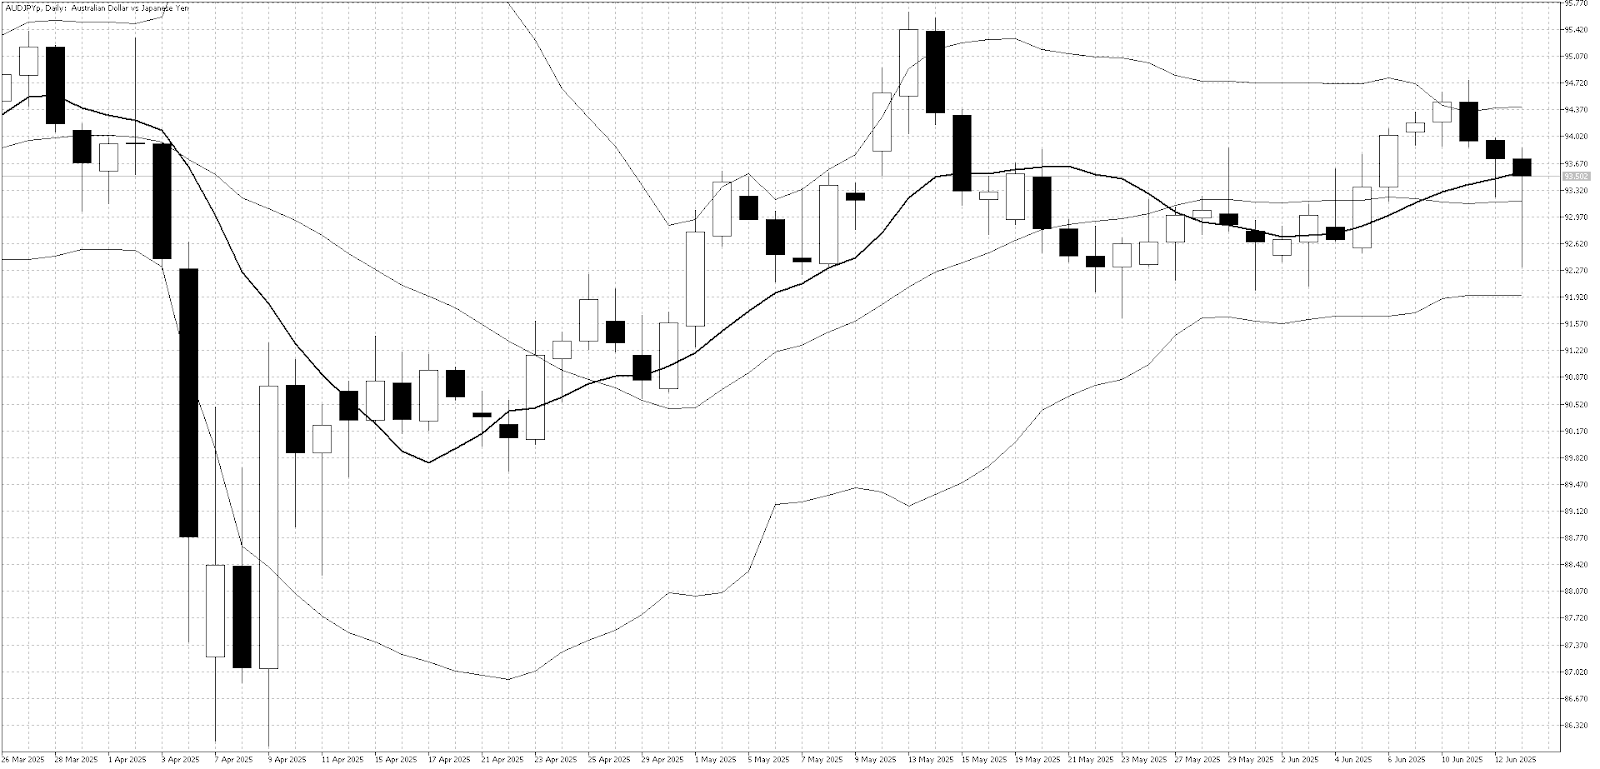
AUD/JPY came under pressure as AUD/USD stalled at 2025 highs, triggering profit-taking. A sell signal from the upper Bollinger Band early in the week encouraged speculators to reduce long positions, weighing on AUD/JPY.
Technical Picture:
The 91.50–95.00 range remains intact after last week’s failure at resistance. The 10-day moving average continues to trend higher, and with gold prices staying firm, the short-term uptrend in AUD/JPY is still supported.
Outlook This Week:
Range trading remains the preferred strategy. Middle East tensions are negative for AUD/JPY, but optimism around avoiding a trade war with China is helping to limit downside and support sentiment.
NZD/JPY

Last Week Recap:
NZD/JPY tested resistance at last month’s highs near 88, as NZD/USD faced selling pressure around its 2025 peak. A sharp sell-off followed Friday’s Middle East conflict news, but strong buying quickly emerged, lifting the pair into the weekly close.
Technical Picture:
The market broke out of its recent 85–87 range, but resistance around last month’s highs remains firm. The Bollinger Band triggered a successful sell signal midweek and now points to buying opportunities near the lower band, reinforcing the current range-trading environment.
Outlook This Week:
A slight upward trend remains in place, and resistance levels at 87 and 88 may be tested again. Range trading continues to be the most effective approach in the short term.
EUR/USD
Last Week Recap:
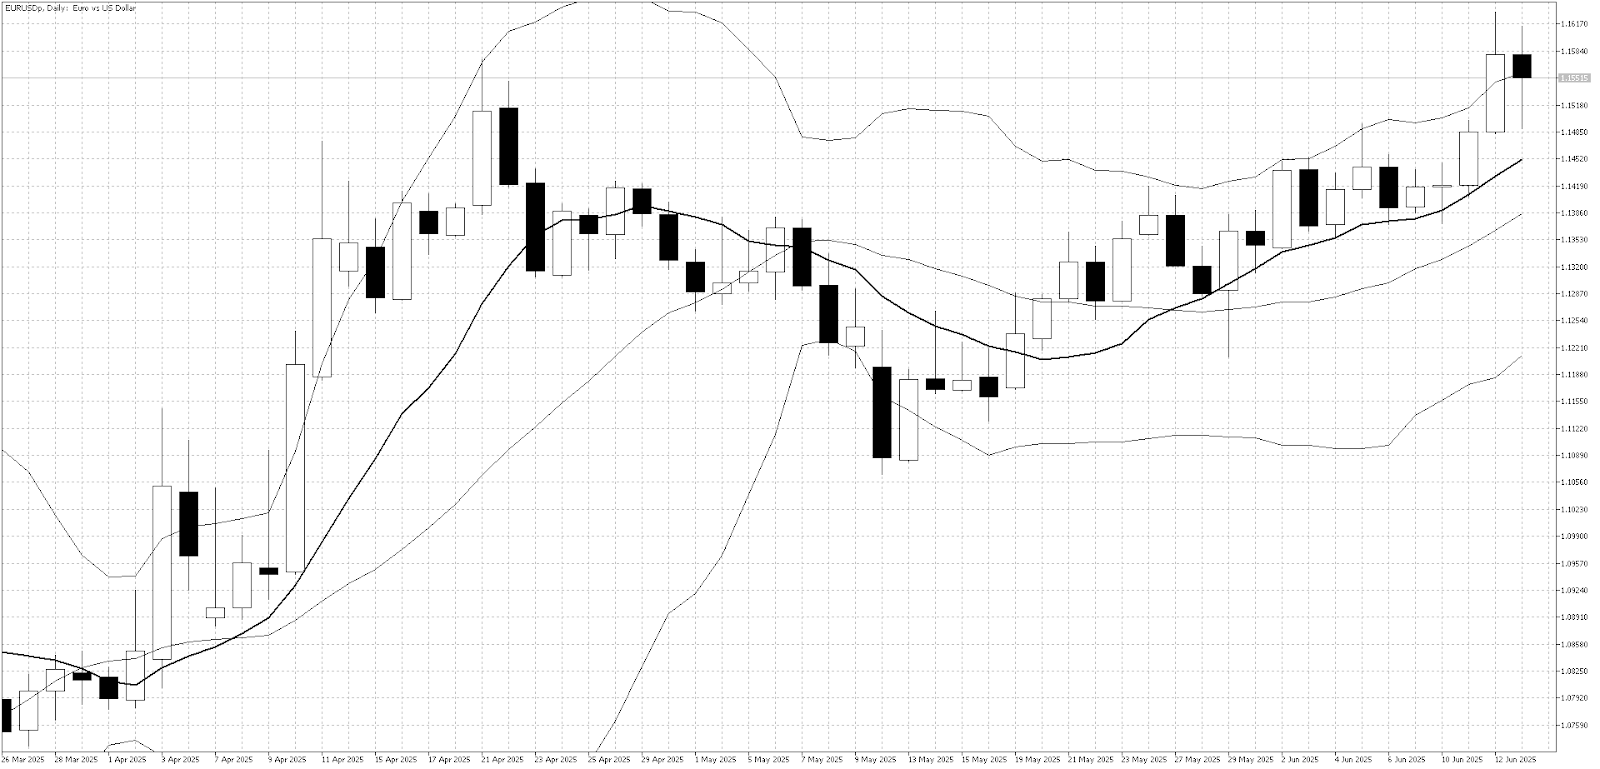
EUR/USD surged to new three-year highs as the market continued to shift away from the U.S. dollar. Growing confidence in U.S. trade negotiations also supported positive sentiment toward the euro.
Technical Picture:
The pair broke above the yearly highs and touched the upper Bollinger Band last week, confirming strong momentum. Importantly, price action is not yet overbought when compared to the 10-day moving average, leaving room for further gains.
Outlook This Week:
The uptrend remains intact. If EUR/USD fails to hold above the 1.1550 resistance level, a short-term pullback could present a selling opportunity. Otherwise, traders may prefer to wait for a dip toward the 10-day moving average to enter long positions.
GBP/USD
Last Week Recap:
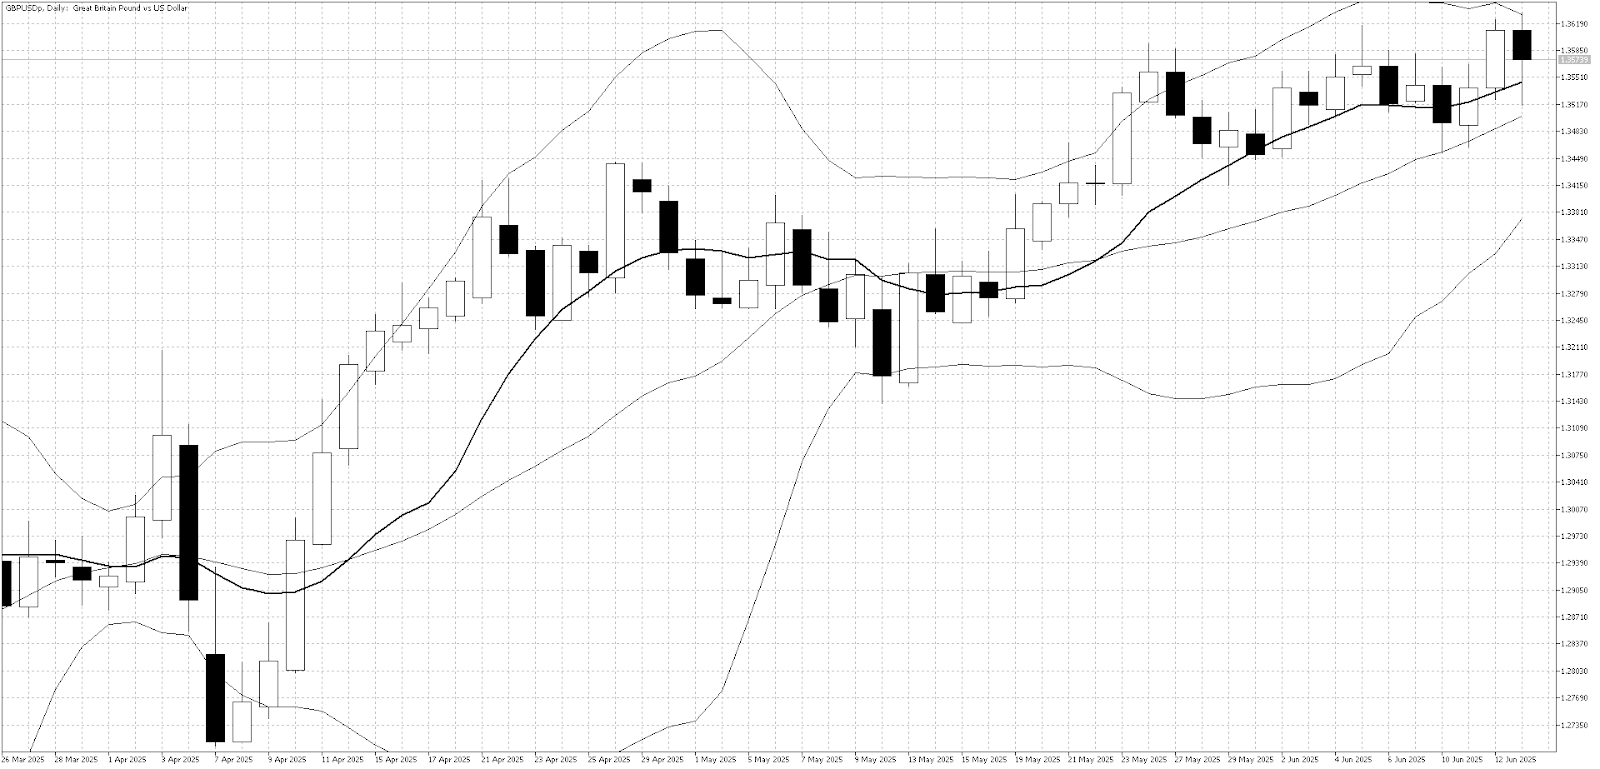
Despite weaker-than-expected UK growth data, GBP/USD climbed to a new three-year high last week. The move was driven primarily by sustained U.S. dollar weakness, with little resistance above to slow the rally.
Technical Picture:
The upper Bollinger Band is beginning to flatten, suggesting near-term resistance, but the 10-day moving average continues to point higher, indicating the uptrend remains intact. Price action confirms strong momentum.
Outlook This Week:
Resistance near 1.3600 has been tested multiple times over the past month, reinforcing the strength of the uptrend. Persistent USD selling remains a dominant market theme, and the outlook stays bullish as long as the pair holds above the 10-day moving average.
Best currency pairs to trade: What to choose and why
Want to know which currency pair is actually worth trading? It’s not just about what’s trending – it’s about what fits your style.
Equities
U.S. Stock Market
Last Week Recap:
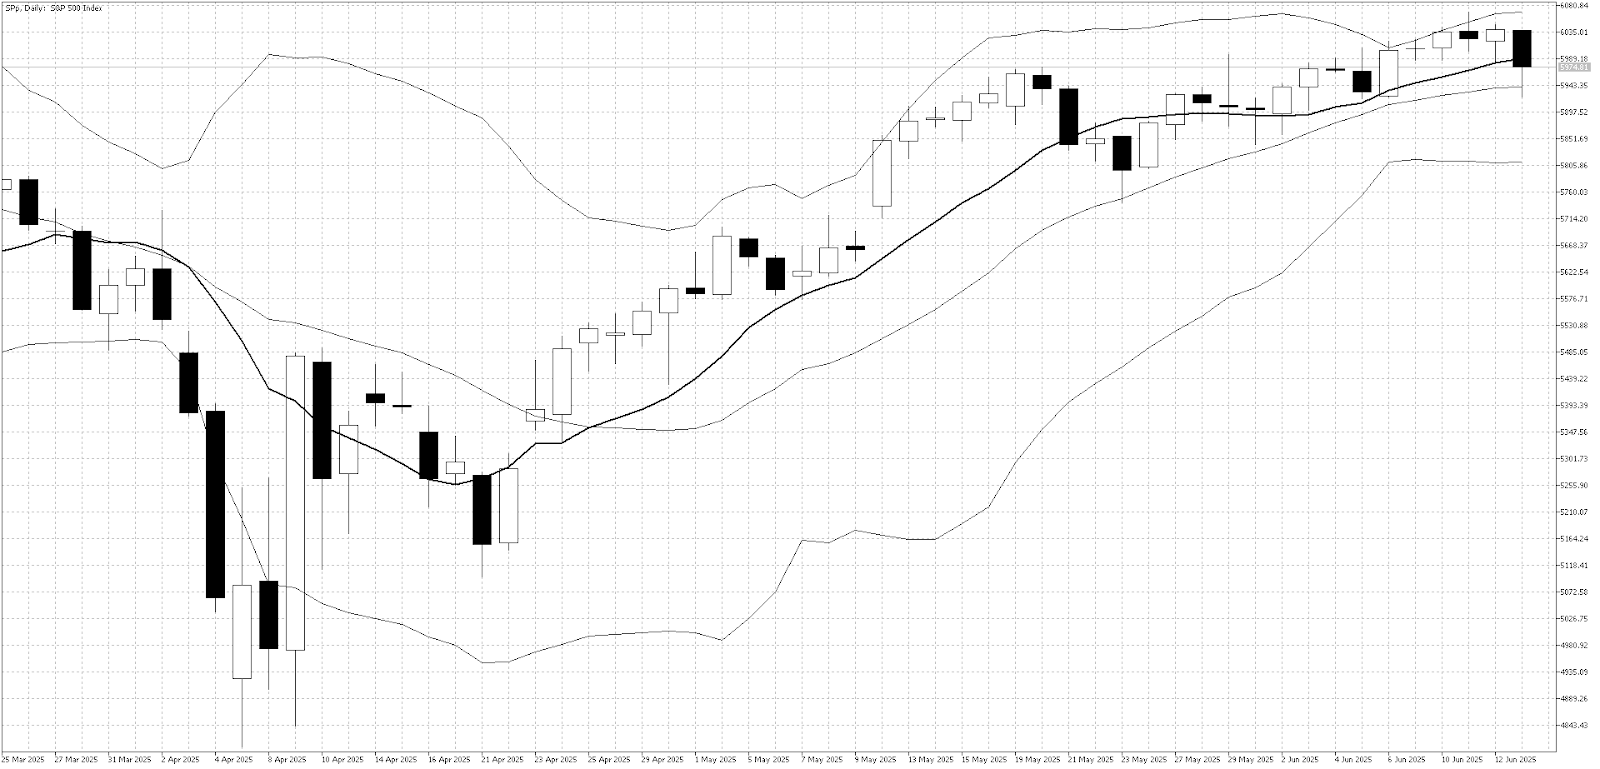
U.S. equities extended their recent strong performance for most of last week, supported by President Trump’s optimistic comments on trade negotiations with China. However, rising tensions in the Middle East caught markets off guard on Friday, triggering a late-week pullback.
Technical Picture:
The S&P 500 broke through the key 6000 level, and despite Friday’s dip, the uptrend remains intact. Bollinger Bands still suggest further upside potential, as the market is not yet overbought.
Outlook:
Unless there is a sharp escalation in Middle East tensions or negative surprises on the trade front, the medium-term trend remains bullish. For this week, range trading may offer the best short-term opportunities while the broader uptrend stays in place.
Commodities
Gold
Technical Picture:
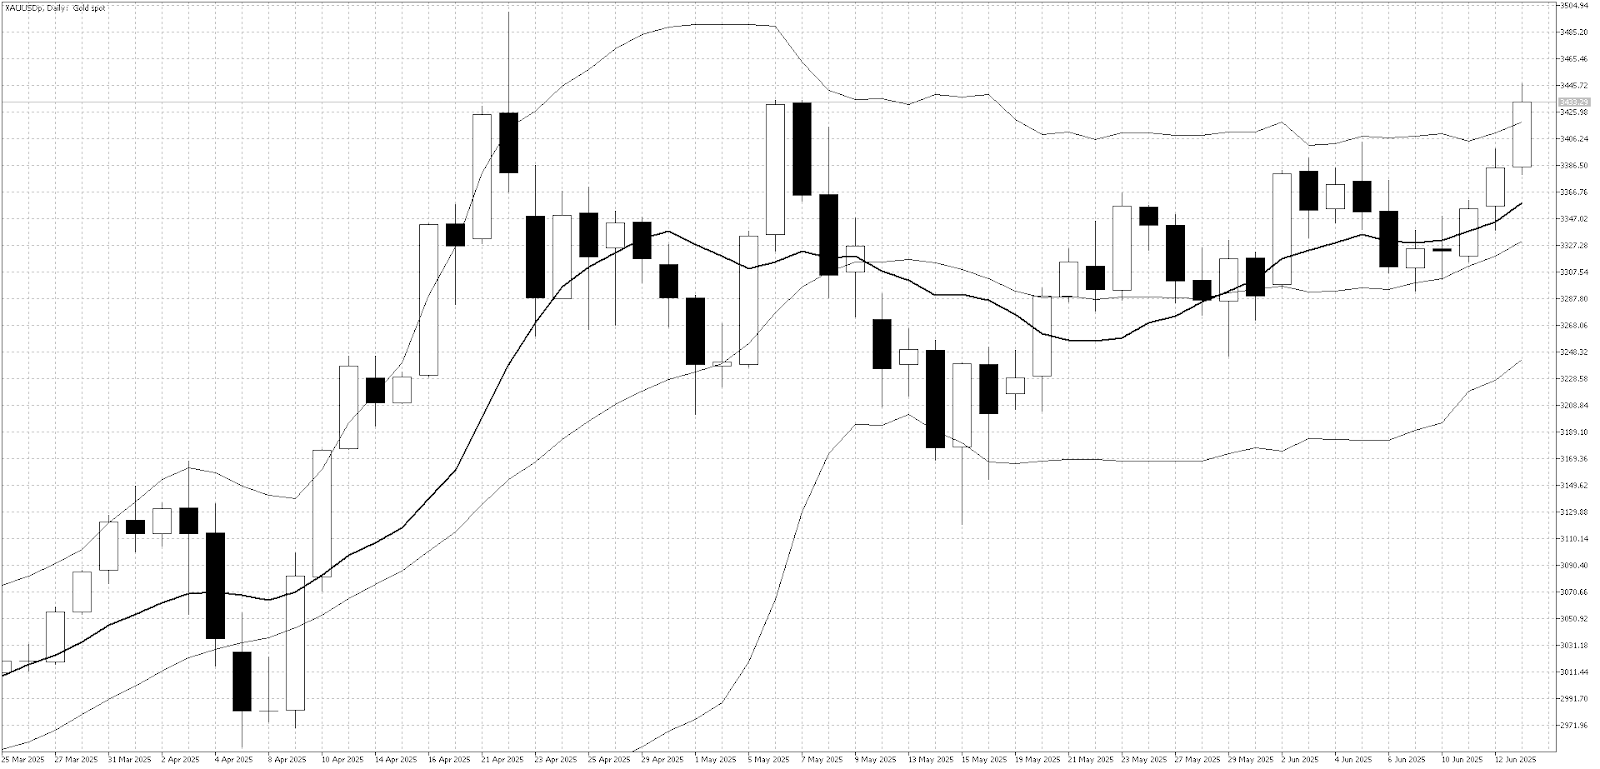
Gold broke above the key $3,400 resistance level and closed the week above the upper Bollinger Band, signaling a strong trend. A move back below the upper band would trigger a short-term sell signal. The medium-term uptrend has resumed, supported by the upward-sloping 10-day moving average.
Outlook This Week:
Technical indicators continue to point higher, and the fundamental backdrop remains supportive. The bias is to the upside, with buying on dips likely to remain the best strategy. However, the market is overbought in the short term, so if Middle East tensions ease, there may be a brief selling opportunity early in the week.
Crude Oil
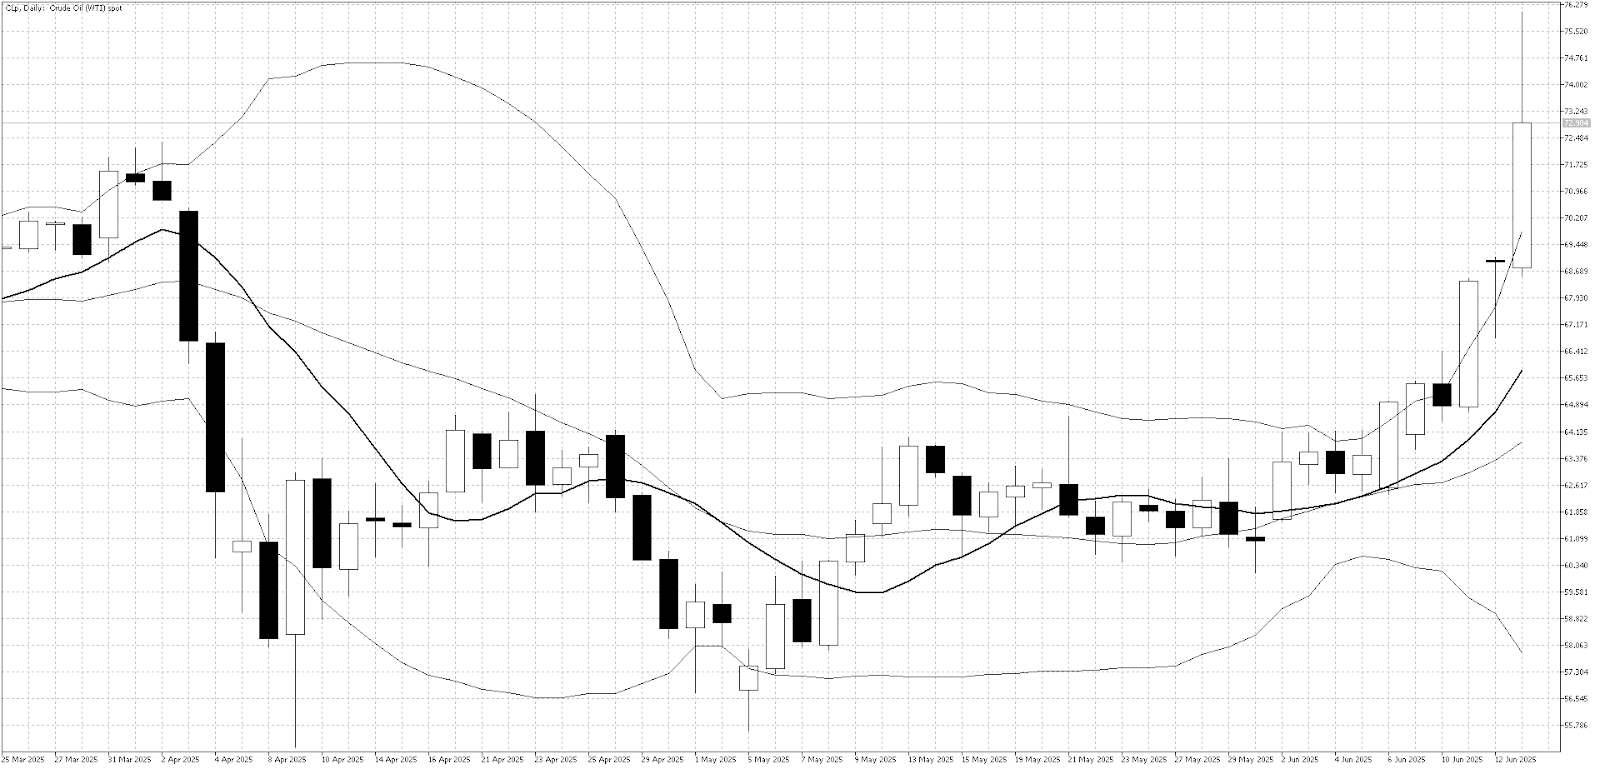
Last Week Recap:
Crude oil surged last week as direct conflict between Israel and Iran rattled markets. The breakout above the long-standing $55–$65 range, which had contained prices since April, signaled a sharp shift in sentiment and attracted aggressive buying.
Technical Picture:
Oil prices moved decisively above the upper Bollinger Band as traders rushed to buy in a low-liquidity environment with few sellers. The market is now clearly overbought, with resistance seen at $75 and $80. A wide gap from the 10-day moving average also highlights the stretched conditions.
Outlook This Week:
The market remains highly sensitive to further developments in the Middle East that could impact global supply. In the short term, overbought conditions may offer selling opportunities. For medium-term traders, there may be room to sell if tensions de-escalate—or to wait for a pullback before re-entering long positions.
What to watch out for this week?
Tensions between Israel and Iran will continue to impact oil and overall market sentiment—this is the major news to watch this week. Traders will also be focused on U.S. Retail Sales and Industrial Production to gauge the strength of the economy and implications for future Fed decisions. Central banks in Japan, the U.K., and the U.S. are expected to hold rates steady, but post-meeting comments could still move markets. Japanese Prime Minister Shigeru Ishiba will meet with U.S. President Donald Trump at the G7 summit in Canada to press for the removal of U.S. tariffs, while U.S.–China trade talks remain ongoing and could produce headline news.


