Market Sector Scanner: New Tariffs and Weak U.S. Jobs Data Shake Markets. Short-Term Move or New Trend?
President Trump’s announcement of new global tariffs and disappointing U.S. employment data triggered sharp market swings. The dollar reversed course, gold jumped, and stocks fell. With volatility rising, traders now ask: is this a short-term reaction or the start of a broader trend? All eyes are on trade headlines in the days ahead.

Markets had a wild week as early optimism from a U.S.–Europe trade deal was wiped out by President Trump’s surprise announcement of new global tariffs, including a 35% levy on Canadian imports starting August 7. This hurt global stocks, especially in Asia and Europe. The Federal Reserve and Bank of Japan both kept interest rates unchanged, with the Fed signaling patience and the BOJ holding back from any hawkish moves despite raising its inflation outlook. The U.S. dollar rose early in the week on strong GDP data, but Friday’s much weaker-than-expected jobs report caused a sharp reversal. With rate cut expectations for September rising, the dollar fell, gold surged, and stocks, oil, and Bitcoin dropped as investors worried about trade tensions and slowing growth.
Scan for opportunities on:
Key Events Calendar for August 4 – August 8
Market Sector Scanner
Forex Market
USD/JPY
Last Week Recap:
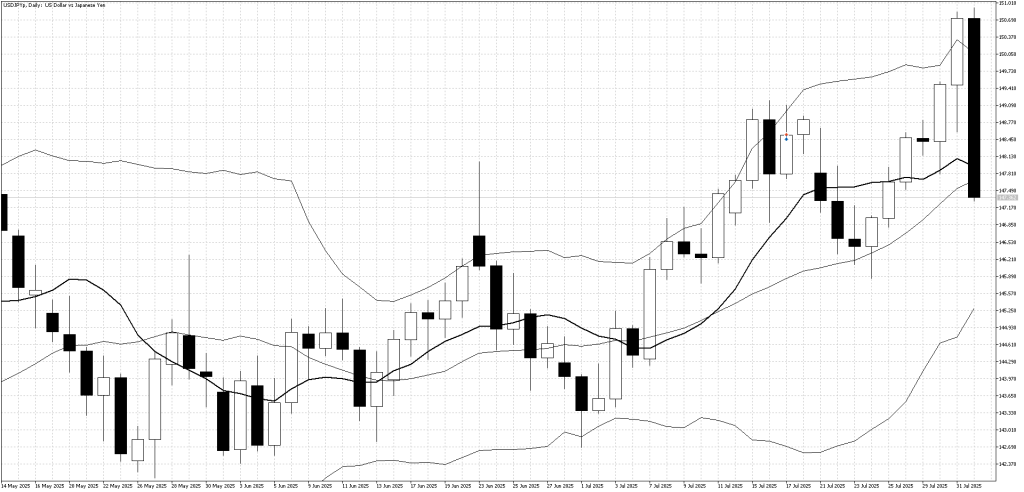
USD/JPY jumped above 150 early last week, supported by strong U.S. economic data and comments from Fed Chair Powell suggesting rate cuts won’t happen soon. But the pair dropped sharply after much weaker-than-expected U.S. job numbers, wiping out the week’s gains and ending close to where it started.
Technical Picture:
The upper Bollinger Band acted as resistance last week and signaled a good place to sell. Now, the price is sitting near the middle of the Bollinger Bands, and the 10-day moving average is flat—showing the market is moving sideways.
Outlook This Week:
There aren’t many important data releases this week, so USD/JPY will likely react to expectations for future data and headlines about U.S. trade talks. The pair may stay in a wide range, but another sharp drop is possible if negative trade news hits the market.
GBP/JPY
Last Week Recap:
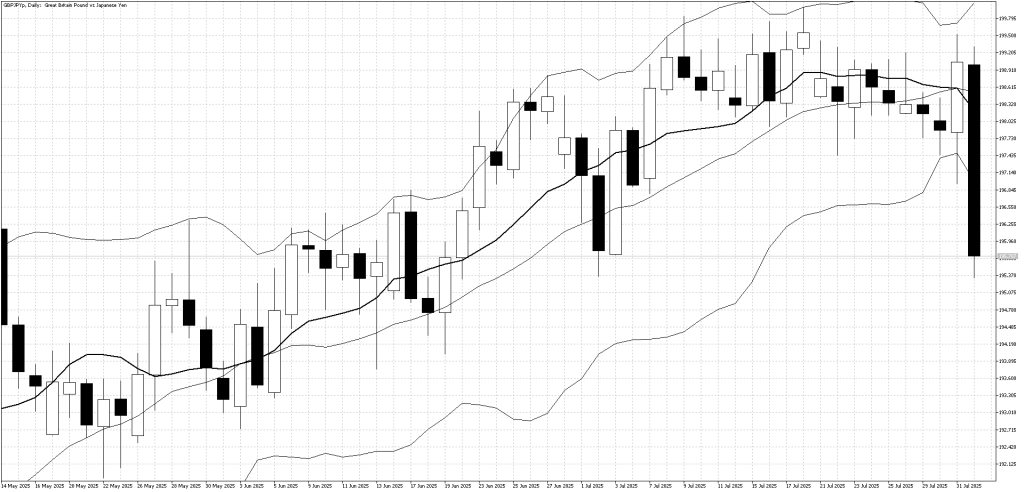
GBP/JPY attempted to reach the 200 level early last week on broad yen weakness but failed to break through. The pair then reversed sharply lower after much weaker-than-expected U.S. employment data, which triggered aggressive selling and erased earlier gains.
Technical Picture:
Bollinger Bands had narrowed due to recent low volatility, but GBP/JPY has now dropped sharply and is trading well below the lower band. The 10-day moving average remains flat, while the price has created a wide gap below it—indicating short-term oversold conditions.
Outlook This Week:
With the market appearing oversold, a short-term bounce is possible at the start of the week. However, multiple rejections around the 200 level suggest a bearish outlook in the medium to long term for GBP/JPY. Traders should be cautious of further downside pressure unless clear support is established.
EUR/USD
Last Week Recap:
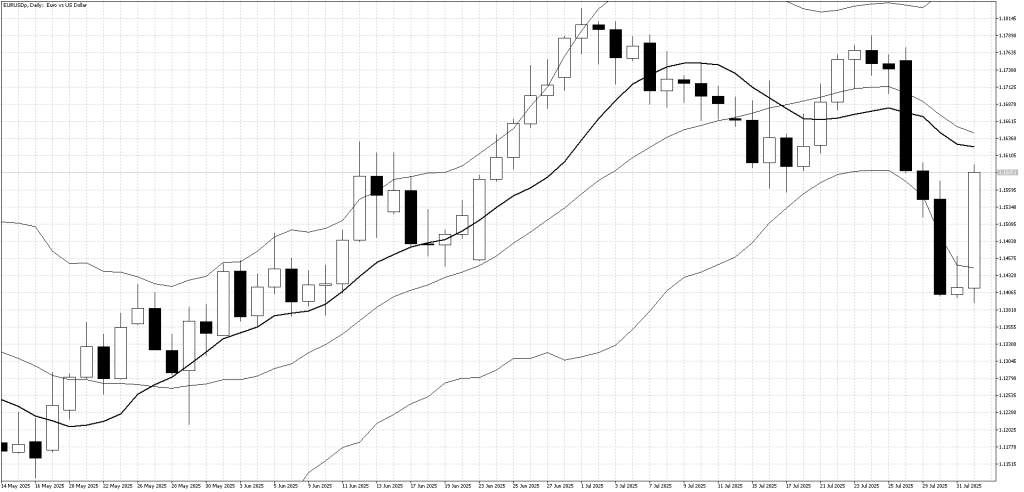
EUR/USD ended the week lower after the Federal Reserve signaled it may delay cutting interest rates, boosting the U.S. dollar. Although weaker-than-expected U.S. employment data on Friday helped the euro recover some losses, it was still a negative week overall for the pair.
Technical Picture:
After breaking below the 10-day moving average, EUR/USD saw aggressive selling pressure. The decline continued until the price found support at the lower Bollinger Band, where some short-term buyers stepped in.
Outlook This Week:
EUR/USD has risen sharply this year, but with technical indicators now pointing lower, the short- to medium-term outlook suggests further weakness is likely. Traders should be cautious of deeper pullbacks unless strong support levels hold.
Want to learn more about fundamental analysis? Our articles will help you!
Equities
U. S. Stock Market
Last Week Recap:
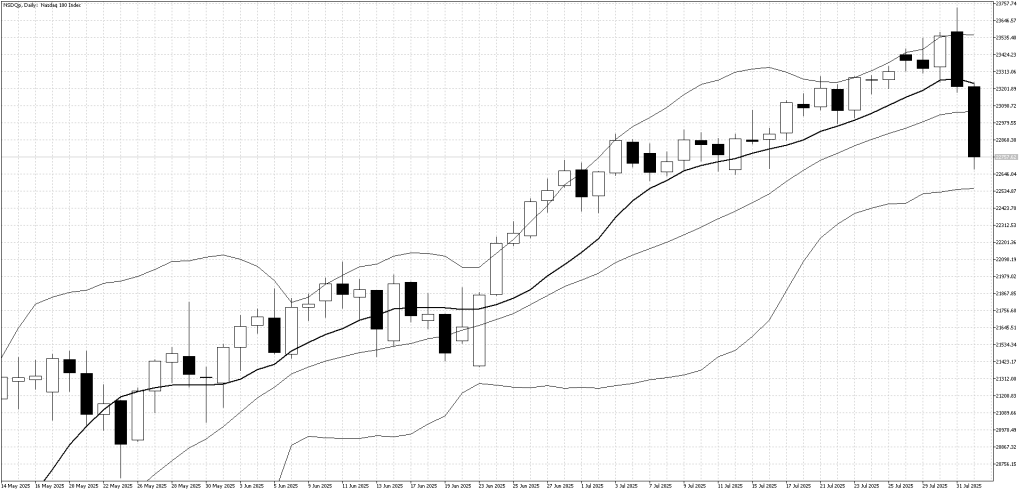
The Nasdaq reached new highs last week as AI-related stocks remained strong and investors stayed optimistic about future growth. However, sentiment quickly shifted after President Trump announced new tariffs and U.S. employment data came in weaker than expected. The index dropped sharply and ended the week down about 2%.
Technical Picture:
A key reversal pattern formed on Thursday, with the Nasdaq making a new high but closing lower—often a bearish signal. The lower Bollinger Band is now close and may act as short-term support. Meanwhile, the 10-day moving average has started to turn slightly lower, which adds to near-term caution.
Outlook:
Traders will be watching closely to see if Friday’s sell-off marks the start of a larger downtrend. While the market looks oversold in the short term, downside risk remains, so any long positions should use tight stops. Positive news on U.S. trade negotiations could trigger a fast rebound, but uncertainty is high heading into the new week.
Commodities
Gold
Last Week Recap:
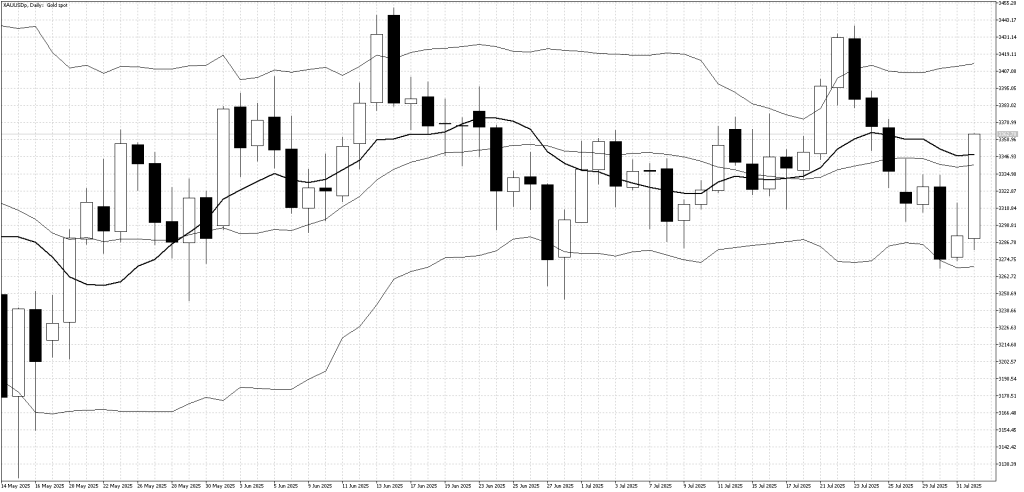
Gold started last week under pressure, as a stronger U.S. dollar triggered steady selling and pushed prices toward the lower end of their recent range. However, by the end of the week, much weaker-than-expected U.S. employment data reversed the dollar’s strength. This shift in sentiment sparked heavy gold buying, allowing prices to recover and end the week higher.
Technical Picture:
The lower Bollinger Band acted as support last week, helping to stop the decline. Both the Bollinger Bands and the 10-day moving average continue to suggest a sideways market, with gold currently trading in a range between $3250 and $3450.
Outlook This Week:
Gold remains well supported on dips, and ongoing U.S. trade risks are likely to be a tailwind. However, the short-term picture looks slightly overbought, so range-bound trading remains the preferred approach for now.
This week could be volatile as traders react to last Friday’s sharp market moves and try to determine whether it was the start of a new trend or just a short-term correction. While the Bank of England’s expected 0.25% rate cut on Thursday is the main scheduled event, PMI releases from several countries will also offer fresh economic signals. However, the biggest focus will likely remain on U.S. trade policy, as President Trump continues to pressure other nations into accepting new trade terms. With few major data releases, headlines and market sentiment could drive sudden price swings as bulls and bears battle for control.

